UNITED STATES
SECURITIES AND EXCHANGE COMMISSION
Washington, D.C. 20549
SCHEDULE 14A
Proxy Statement Pursuant to Section 14(a) of
the Securities
Exchange Act of 1934 (Amendment
(Amendment No. )
Filed by the Registrant ☒ | |||||||||||
Filed by a Party other than the Registrant | |||||||||||
| Check the appropriate box: | |||||||||||
| ☒ | Preliminary Proxy Statement | ||||||||||
| ☐ | Confidential, for Use of the Commission Only (as permitted by Rule 14a-6(e)(2)) | ||||||||||
| ☐ | Definitive Proxy Statement | ||||||||||
| ☐ | Definitive Additional Materials | ||||||||||
| ☐ | Soliciting Material Pursuant to § 240.14a-12 | ||||||||||
| AMERICAN CAMPUS COMMUNITIES, INC. | ||||||||||||||||||||
| (Name of Registrant as Specified in Its Charter) | ||||||||||||||||||||
| Not Applicable | ||||||||||||||||||||
| (Name of Person(s) Filing Proxy Statement, if other Than the Registrant) | ||||||||||||||||||||
| Payment of Filing Fee (Check the appropriate box): | ||||||||||||||
| No fee required. | ||||||||||||||
| ☐ | Fee computed on table below per Exchange Act Rules 14a-6(i)(1) and 0-11. | |||||||||||||
| (1) | Title of each class of securities to which transaction applies: | |||||||||||||
| (2) | Aggregate number of securities to which transaction applies: | |||||||||||||
| (3) | Per unit price or other underlying value of transaction computed pursuant to Exchange Act Rule 0‑11 (set forth the amount on which the filing fee is calculated and state how it was determined): | |||||||||||||
| (4) | Proposed maximum aggregate value of transaction: | |||||||||||||
| (5) | Total fee paid: | |||||||||||||
| ☐ | Fee paid previously with preliminary materials. | |||||||||||||
| ☐ | Check box if any part of the fee is offset as provided by Exchange Act Rule 0-11(a)(2) and identify the filing for which the offsetting fee was paid previously. Identify the previous filing by registration statement number, or the form or schedule and the date of its filing. | |||||||||||||
| (1) | Amount previously paid: | |||||||||||||
| (2) | Form, Schedule or Registration Statement No.: | |||||||||||||
| (3) | Filing party: | |||||||||||||
| (4) | Date filed: | |||||||||||||
SUBJECT TO COMPLETION
PRELIMINARY PROXY MATERIALS DATED MARCH 15, 2022
12700 Hill Country Blvd., Suite T-200
Austin, Texas 78738
Austin, Texas 78738
[ ], 2022
Dear Stockholder:
As a pioneer in the Lantana Room of Disney’s Coronado Springs Resort locatedstudent housing industry, our team at 1000 W Buena Vista Drive, Orlando, Florida. A notice of the meeting, a proxy and a proxy statement containing information about the matters to be acted upon are enclosed.
While delivering sustainable shareholder value, we are committedalso appealing to representingstudents’ increasing desire to make responsible housing choices.
•We are retrofitting our existing communities to promote sustainability and protecting your interests by providing strategic oversightimprove efficiency and are building more Leadership In Energy and Environmental Design (LEED) projects than any other student housing provider—these both save us money and fill growing demand for environmentally sustainable buildings,
•Nearly 95% of our communities are located within a half-mile of campus, increasing their appeal to residents while promoting academic achievement, health and wellness and reducing emissions and noise,
•We make quality housing affordable to students of all backgrounds without sacrificing location or quality, making us highly competitive, and
•We partner with experts to support student mental health and well-being which builds community and connection among our residents, our staff and the Company’s Executive Management team, with auniversities we serve.
We also believe that focus on sustainable long-term value creation. We believecorporate governance is vital to ACC and shareholders. In recent years, we have advanced several important initiatives including board refreshment that the Company’s well-positioned balance sheet, sound strategic business plan,has enhanced director diversity, shareholder perspective, experience in higher education, and stable operating performance are all key factors in the Company’s continuing success.
Our Board and management team have engaged extensively with our shareholders and taken meaningful actions to deliver significant earnings per share growth and continued value creation. While the student housing sector was challenged by the pandemic, ACC has emerged as a stronger company and our efforts are yielding tangible results, including our shares setting new all-time highs several times in December 2021. We are excited about our runway for strong earnings and net asset value growth, which we expect will further drive substantial shareholder returns.
Your vote is especially important this year, and we urge you to cast your vote as soon as possible. A fund managed by Land & Buildings Investment Management, LLC has notified the company of its intention to nominate an employee of Land & Buildings for election to the Board andat the Company advanced several important initiatives including enhancing director diversity and corporate responsibility. These advancements are outlined in the Director Diversity and Corporate Responsibility sections of this proxy statement.
We strongly urge you to read the information forwardedaccompanying Notice of Annual Meeting and Proxy Statement carefully and vote FOR the Board’s nominees and in accordance with the Board’s recommendation on the other proposals by using the enclosed WHITE proxy card. If you have any questions, please
contact MacKenzie Partners, Inc., our proxy solicitor assisting us in connection with the 2022 Annual Meeting. Shareholders in the U.S. and Canada may call toll-free at 1-800-322-2885 or you may call collect at 212-929-5500.
We ask for your bank, broker or other holder of record regarding each of these voting options.support for the items described in the pages that follow and thank you for your investment and trust in us.
On behalf of the Board of Directors,
Sincerely,
Independent ChairmanChair of the Board
12700 Hill Country Blvd., Suite T-200
Austin, Texas 78738
Austin, Texas 78738
NOTICE OF ANNUAL MEETING OF STOCKHOLDERSSHAREHOLDERS
To Be Held April 29, 2020[ ], 2022
The accompanying WHITE proxy card, to be mailed to shareholders together with this Notice of Annual Meeting of Shareholders and this Proxy Statement on or about [ ], 2022 is solicited by the Board of Directors of American Campus Communities, Inc. (the “Company”) in connection with the Annual Meeting of Shareholders (the “Annual Meeting”).
To the Holders of Common Stock of
AMERICAN CAMPUS COMMUNITIES, INC.:
AMERICAN CAMPUS COMMUNITIES, INC.:
The 20202022 Annual Meeting of StockholdersShareholders of American Campus Communities, Inc., a Maryland corporation, will be held in the Lantana Room of Disney's Coronado Springs Resortat our corporate office located at 1000 W Buena Vista Drive, Orlando, Florida,12700 Hill Country Blvd., Suite T-200, Austin, Texas, on Wednesday, April 29, 2020,[ ] [ ], 2022 at 8:00 a.m. (Eastern(Central Time) to consider and take action upon the following:
(i)To elect ten directors to a one-year term of office expiring at the 2023 Annual Meeting of Shareholders or until their successors are duly elected and qualified;
(ii)To ratify Ernst & Young LLP as our independent auditors for 2022;
(iii)To hold an advisory vote on executive compensation; and
(iv)To consider and act upon any other matters that may properly be brought before the Annual Meeting and at any adjournments or postponements thereof.
The enclosed WHITE proxy card is solicited by the Board of Directors, which recommends that our stockholdersshareholders vote FOR the election of the nominees named therein and FOR approval, on an advisory basis, of the compensation of our named executive officers. The Audit Committee, which has the sole authority to retain our independent auditors, recommends that you vote FOR the ratification of Ernst & Young LLP as our independent auditors for 2020.2022. Please refer to the attached Proxy Statement for further information with respect to the business to be transacted at the Annual Meeting.
The Board of Directors has fixed the close of business on March 9, 2020,[ ], 2022, as the record date for determining the stockholdersshareholders entitled to notice of and to vote at the Annual Meeting and at any adjournments or postponements thereof. Only stockholdersshareholders of record of our common stock at the close of business on that date will be entitled to notice of and to vote at the Annual Meeting and at any adjournments or postponements thereof.
It is important that your shares be represented and voted whether or not you plan to attend the Annual Meeting in person. Whether or not you plan to attend the Annual Meeting in person, please mark, execute, date and return the enclosed WHITE proxy card in the postage-prepaid envelope provided. Voting by written proxy will ensure your shares are represented at the Annual Meeting. Should you attend the Annual Meeting in person you may, if you wish, withdraw your proxy and vote your shares in person. Please review the instructions on the WHITE proxy card or the information forwarded by your bank, broker or other holder of record regarding each of these voting options.
Please note that Land & Buildings Capital Growth Fund, LP, a fund managed by Land & Buildings Investment Management, LLC (“Land & Buildings”), has notified us that it intends to nominate one of Land & Buildings’ employees for election to our Board of Directors at the Annual Meeting. You may receive solicitation materials from Land & Buildings, including a proxy statement and [COLOR] proxy card. We are not responsible for the accuracy of any information provided by or relating to Land & Buildings or its nominee contained in solicitation materials filed or disseminated by or on behalf of Land & Buildings or any other statements Land & Buildings may make.
Our Board of Directors does not endorse the Land & Buildings nominee and unanimously recommends that you vote “FOR” the election of all nominees proposed by the Board of Directors on the WHITE proxy card (including via the telephone or Internet methods of voting specified). Our Board of Directors strongly urges you not to return or vote any [COLOR] proxy card sent to you by Land & Buildings. Please note that voting to “withhold” with respect to the Land & Buildings nominee on a [COLOR] proxy card sent to you by Land & Buildings is not the same as voting “for” the Board of Directors’ nominees, because a vote to “withhold” with respect to the Land & Buildings nominee on its [COLOR] proxy card will revoke any WHITE proxy you may have previously submitted.
To support the Board of Director’ nominees, you should vote FOR the Board of Directors’ nominees on the WHITE proxy card and disregard, and not return, any [COLOR] proxy card sent to you by Land & Buildings. If you have previously submitted a [COLOR] proxy card sent to you by Land & Buildings, you can revoke that proxy and vote for our Board of Directors’ nominees by using the enclosed WHITE proxy card (including via the telephone or Internet methods of voting specified thereon) which will automatically revoke your prior proxy. Any later-dated [COLOR] proxy card that you send to Land & Buildings will also revoke your proxy, including WHITE proxies that you have voted FOR our Board of Directors’ nominees, and we strongly urge you not to sign or return any [COLOR] proxy cards sent to you by Land & Buildings. Only the latest dated validly executed proxy that you submit will be counted.
Given the contested nature of the election, under the rules of the NYSE, if your shares of common stock are held through a broker, bank or other nominee in “street name” as of the close of business on the record date and you receive proxy materials from Land & Buildings, your broker, bank, or other nominee will only be able to vote your shares with respect to any proposals at the Annual Meeting if you have instructed them how to vote. Your broker, bank, or other nominee has enclosed a WHITE voting instruction form for you to use to direct them regarding how to vote your shares. Please instruct your broker, bank, or other nominee how to vote your shares using the WHITE voting instruction form you received from them. Please return your completed WHITE proxy card or WHITE voting instruction form to your broker, bank, or other nominee and contact the person responsible for your account so that your vote can be counted. In most instances, you will be able to do this over the Internet or by telephone, or by mail as indicated on your WHITE voting instruction form and utilizing the post-paid return envelope provided.
If you have questions about the matters described in this proxy statement, how to submit your proxy or if you need additional copies of this proxy statement, the enclosed WHITE proxy card, you should contact our proxy solicitor, MacKenzie Partners, Inc., assisting us in connection with the Annual Meeting. Shareholders in the U.S. and Canada may call toll-free at 1-800-322-2885 or you may call collect at 212-929-5500.
By Order of the Board of Directors,
DANIEL B. PERRY
Executive Vice President, Chief Financial Officer,
Treasurer and Secretary
Austin, Texas
[ ], 2022
| Important Notice Regarding the Availability of Proxy Materials for the | ||
| Annual | ||
| This Proxy Statement, Annual Report to | ||
| fiscal year ended December 31, | ||
website at www.AmericanCampus.com under “SEC Filings.” | ||
TABLE OF CONTENTS
| Proxy Statement Summary | |||||
| Corporate Governance | |||||
| Board Composition and Refreshment | |||||
| Board Independence and Meetings | |||||
| Board Leadership Structure; Separate Independent | |||||
| Board’s and Committees' Roles in Risk Oversight | |||||
| Board Committees | |||||
| Director Qualifications; Limits on Board Service | |||||
| Term Limits; Retirement Age | |||||
| Board Diversity | |||||
| Number of Directors; Director Vacancies | |||||
| the Ordinary Course of Business | |||||
| Guidelines on Governance and Codes of Ethics | |||||
| Management Succession | |||||
| Director Stock Ownership Guidelines | |||||
| Short Selling, Hedging and Pledging Prohibitions | |||||
| Repricing and Cash Buyouts of Underwater Options and Stock Appreciation Right Prohibitions | |||||
| Prohibition on Classifying the Board | |||||
| Compensation of Directors | |||||
| Our Company | |||||
| Executive Officers | |||||
| Security Ownership | |||||
| Section 16(a) Beneficial Ownership Reporting Compliance | |||||
| Executive Compensation | |||||
| Compensation Committee Report | |||||
| Compensation Discussion and Analysis | |||||
| Summary Compensation Table | |||||
| Grants of Plan Based Awards | |||||
| Employment Contracts | |||||
| Outstanding Equity Awards at Fiscal Year-End | |||||
| Awards Vested | |||||
| Potential Payments Upon Termination or Change in Control | |||||
| Nonqualified Deferred Compensation | |||||
| Equity Compensation Plan | |||||
| CEO Compensation Pay Ratio | |||||
| Certain Relationships and Related Transactions | |||||
| Questions and Answers | |||||
| Proposal 1 - Election of Directors | |||||
| Consideration of Director Nominees | |||||
| Proposal 2 - Ratification of the Selection of the Independent Auditors | |||||
| Audit Committee Information | |||||
| Report of the Audit Committee | |||||
| Independent Auditor Fees | |||||
| Proposal 3 - Advisory Vote on Executive Compensation | |||||
| Appendix A | |||||
i
American Campus Communities, Inc.
12700 Hill Country Blvd., Suite T-200
Austin, Texas 78738
Austin, Texas 78738
__________________________
PROXY STATEMENT
__________________________
The accompanying WHITE proxy card, to be mailed to stockholdersshareholders together with the Notice of Annual Meeting of StockholdersShareholders and this Proxy Statement on or about March 16, 2020,[ ], 2022, is solicited by the Board of Directors of American Campus Communities, Inc. (the “Company”) in connection with the Annual Meeting of StockholdersShareholders (the “Annual Meeting”) to be held on April 29, 2020.[ ], 2022.
PROXY STATEMENT SUMMARY
The following summary highlights important information you will find in this Proxy Statement regarding matters to be considered at the Annual Meeting. As it is only a summary, please read the other information contained in this Proxy Statement before you vote.
Board Composition and Refreshment
The Nominating and Corporate Governance Committee of the Board of Directors regularly reviews the overall composition of the Board and its committees to assess whether they reflect the appropriate mix of skills, experience, backgrounds and qualifications that are relevant to our current and future business and strategy. Each member of our Board has the necessary qualifications, expertise, and attributes in real estate, business, leadership, and financial literacy to be an effective member of the Board. Our director nominees’ biographies describe each director’s background and relevant experience in more detail.
Thoughtful consideration is continuously given to the composition of our Board in order to maintain an appropriate mix of experience, qualifications and attributes, introduce fresh perspectives, and broaden and diversify the views and experience represented on the Board. As a result of our focus on refreshment, we added three new independent directors to our Board in early 2021. Currently, five of our independent directors have a tenure of less than five years, two have a tenure of five to ten years, and two have a tenure greater than ten years.
Governance Highlights
The Board of Directors and the Company are committed to strong corporate governance to promote the long-term interests of stockholders,shareholders, strengthen management and director accountability, and help to maintain public trust in the Company. During 2021, the Company made the following enhancements to its governance profile:
•Refreshing and enhancing board diversity by identifying and appointing three new highly-qualified independent directors, resulting in a 40% diverse Board with an average independent director tenure of less than 7 years. These three new directors, Herman Bulls, Alison Hill and Craig Leupold provide a breadth of expertise, such as extensive real estate experience, including capital allocation and institutional fund management, public company expertise, executive leadership, financial literacy and extensive experience with strategic transactions;
•Appointing Cydney Donnell as new Independent Board Chair. Ms. Donnell provides extensive investment experience and shareholder perspectives from her prior role as former Principal and Managing Director of European Investors / EII Realty Securities;
•Forming a Capital Allocation Committee, an advisory committee designated to evaluate the Company’s capital allocation strategy and priorities to further improve investment strategies, net asset value creation and the quality of earnings growth. The "Governancecommittee consists of four independent directors, chaired by Craig Leupold, former CEO of Green Street Advisors – a leading independent research and advisory firm for the real estate industry known for its analysis regarding corporate governance and capital allocation. During 2021, the committee met eight times, as well as multiple additional working sessions with and without management, to evaluate historic investment results and make appropriate recommendations to the Company’s short and long-term capital allocation strategy; and
•Making significant advancements in the Company’s ESG program as outlined under Corporate Responsibility / ESG, below.
1
The “Governance of the Company"Company” section describes the governance framework, which includes the following highlights:
• | Separate Chief Executive Officer and Independent | • | Robust board refreshment and | |||||||||||
| • | ||||||||||||||
• | ||||||||||||||
| Gender diversified board with 30% of director nominees being women, including of our independent Chair | ||||||||||||||
| • | Prohibition on a classified board structure | • | Limits on board service | |||||||||||
• | 9 of | • | Director and senior officer stock ownership guidelines, which include a prohibition on the sale by senior officers of vested restricted stock awards until the applicable ownership guideline has been met, and a requirement that the Chief Executive Officer own common stock having a market value of at least six times his annual base salary | |||||||||||
| • | ||||||||||||||
| • | ||||||||||||||
| • | Board oversight of environmental, social and governance practices, including human capital management matters | • | Anti-hedging and anti-pledging policies | |||||||||||
• | Risk oversight by full Board and committees and independent Audit Committee and Strategic Planning and Risk Committee | • | Clawbacks to recoup compensation | |||||||||||
| • | Ongoing succession planning for directors, the Chief Executive Officer and other executive officers | • | No directors or executive officers a party to any material related party transactions | |||||||||||
| • | ||||||||||||||
• | ||||||||||||||
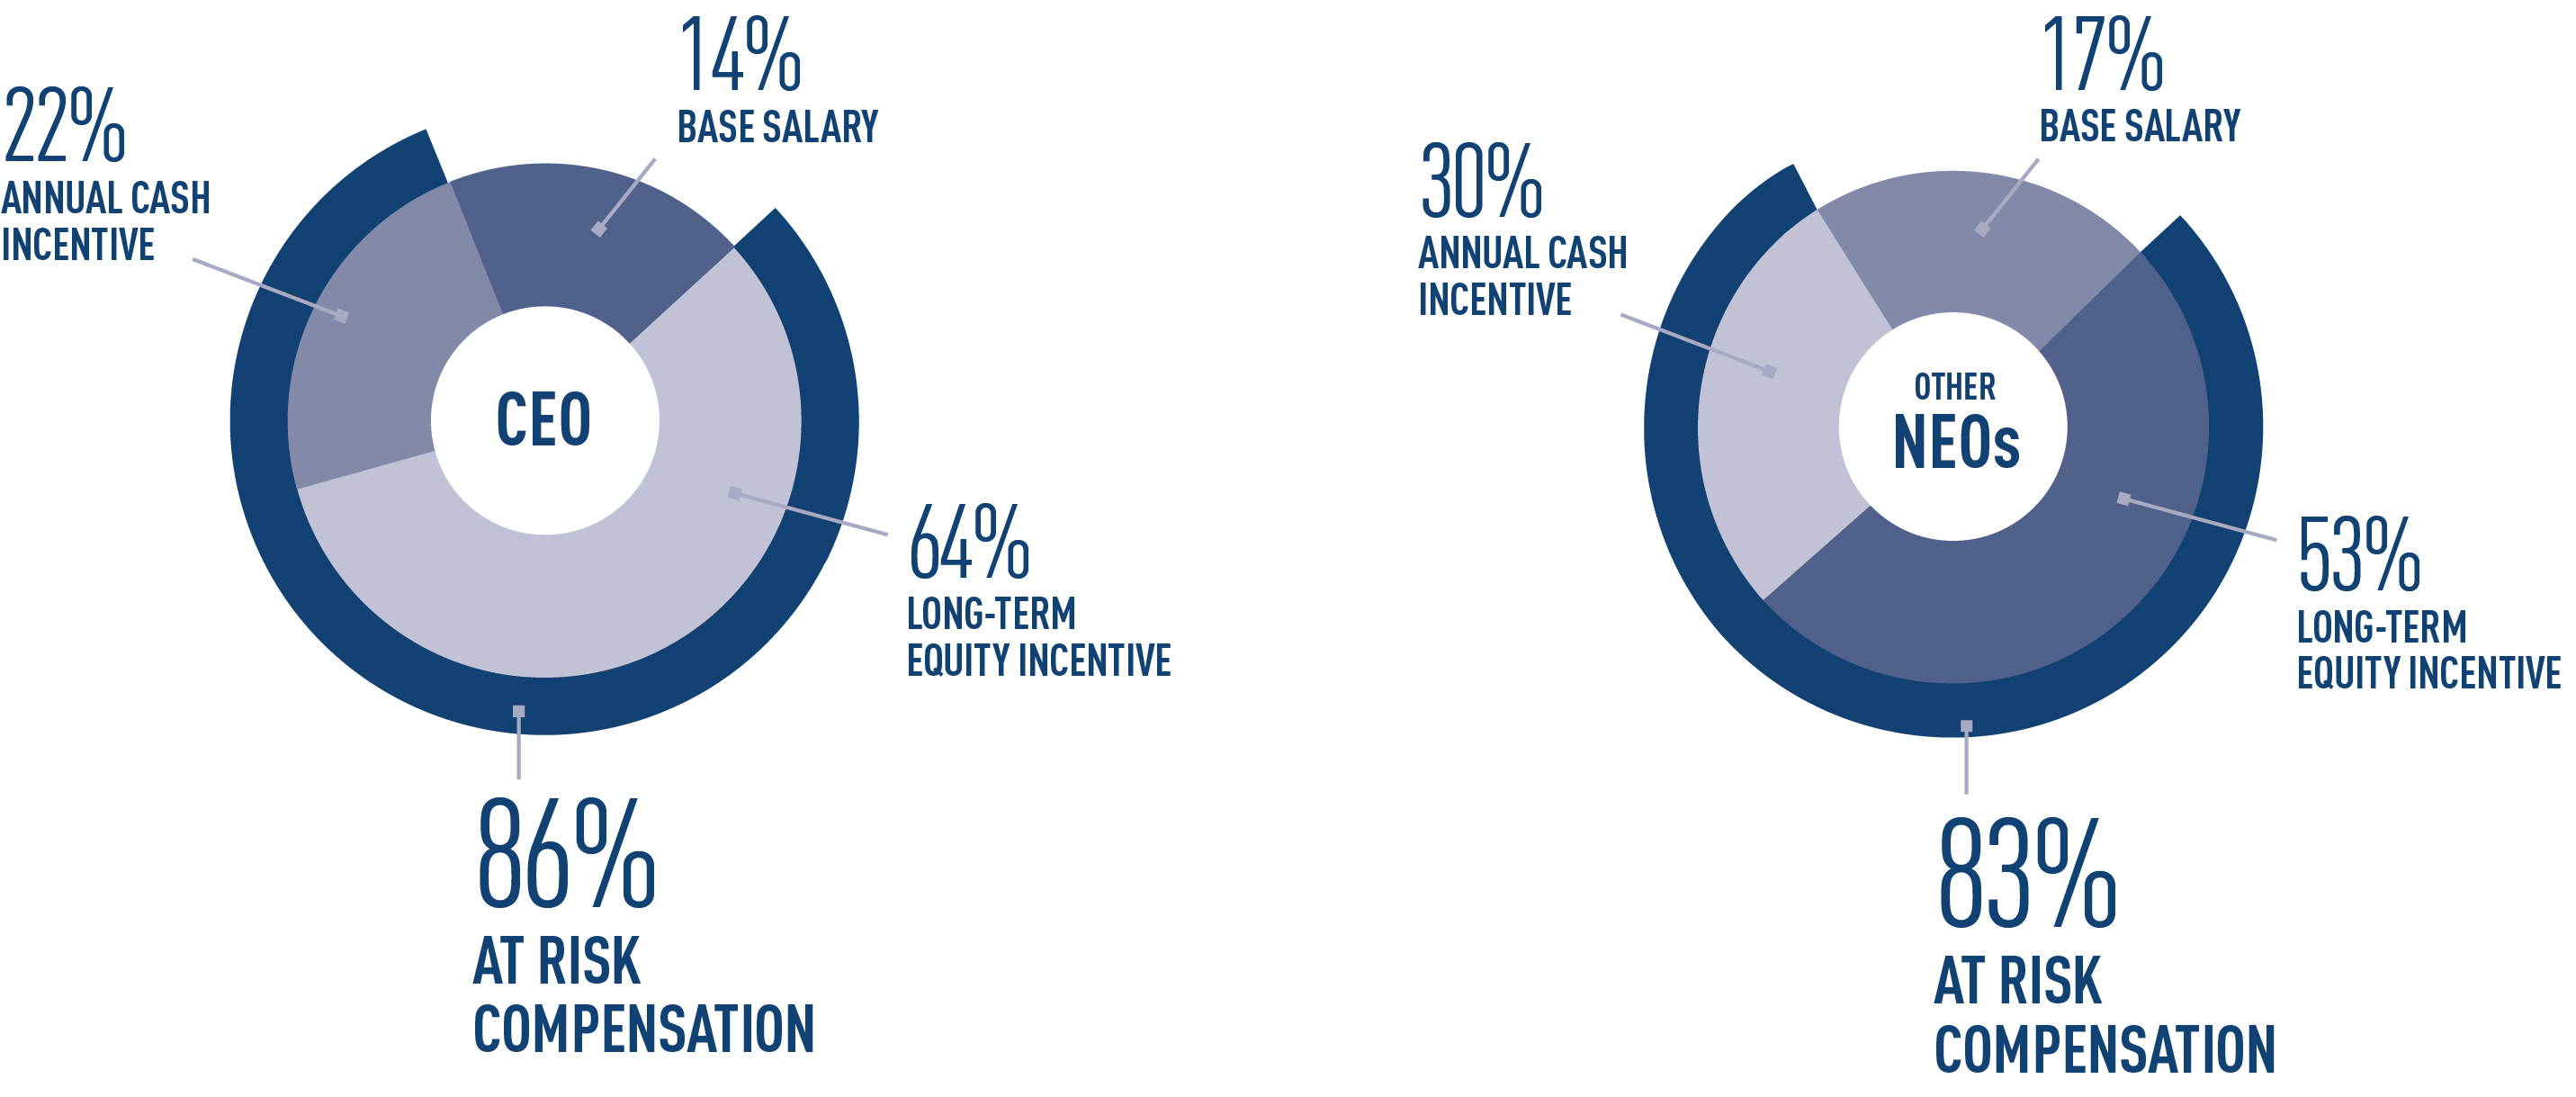
The Company’s executive compensation programs are designed to attract, retain and motivate talented executives, to reward executives for the achievement of pre-established Company and tailored individual goals consistent with the Company’s strategic plan and to link compensation to Company performance. Executives are primarily compensated through base salary, annual cash incentive compensation and long-term equity incentive compensation. The Company’s executive compensation philosophy emphasizes performance-based incentive compensation over fixed cash compensation so that the vast majority of total direct compensation is variable and not guaranteed, as displayed below in the visual diagram of 20192021 target compensation for the Chief Executive Officer, or CEO, and other named executive officers or NEOs. In addition, a significant percentage of incentive compensation is in the form of equity awards granted to reward performance. Although theseThese performance-based equity awards include one and three-year pre-determined performance metrics, are fully earned at the time of grant and vest ratably over a substantial portionfive-year period, thereby enhancing executive retention and closely aligning executive and shareholder interests as the value of the awards vests over time, furnishing additional retention benefits and achieving enhanced alignmentaward increases or decreases with stockholders.the value of the Company's share price. We believe this structure appropriately focuses the executive officers on the creation of long-term value and encourages prudent evaluation of risks.
We also believe that regular engagement with shareholders is essential to the ongoing development of our executive compensation programs and practices. As detailed under “Shareholder Outreach, Stakeholder Engagement and Communication”, we regularly communicate with our shareholders who have consistently supported our executive compensation program. At our 2019 Annual Meeting of Stockholders, 96% of the votes cast were voted in favor of our resolution seeking advisory approval of our executive compensation. Over the last five years, stockholdershareholder support for our advisory vote on executive compensation has averaged 93%95%. While we have consistently had strong stockholdershareholder support for our executive compensation program, the Compensation Committee does use an independent compensation consultant to review the structure of our compensation program, provide compensation benchmarks and to assess the effectiveness of our program in aligning executive and stockholdershareholder interests.
2
Pay-At-Risk: 20192021 Direct Compensation Target

The 2021 compensation decisions once again reflectedmade by the Compensation Committee reflect strong continued alignment between pay and performance with respect to the pre-established measures and goals under the annual cash and long-term equity incentive plans and the performance and contributions of the Named Executive Officers to the Company’s financial and operating performance. In determining the incentive compensation paid to named executive officersthe Named Executive Officers for 2019,2021, the Compensation Committee rigorously evaluated Company and individual performance relative to the pre-established measures and goals, underbut also took into consideration management’s considerable efforts and leadership in continuing to successfully navigate the annual cashCompany through the lingering disruption of COVID-19 in an effort to re-stabilize our operations in 2021.
It is worth acknowledging that the Company’s 2021 outlook, and long-term equity incentive plans.
2021 Performance Amidst a Global Pandemic
Operationally, the Company began 2021 facing significant uncertainty and disruption caused by the COVID-19 pandemic. Guided by our eight principle objectives outlined early in the pandemic, which are detailed under “COVID-19 Response”, we continued to provide essential housing services to students all across the country and provided thought leadership and action to help universities return to a sense of normalcy.
We continued to employ numerous decisive actions which began in the earliest days of the Company’s long-term strategic initiatives. The determination reflectedpandemic and served to protect our team members, our residents and our shareholders:
•Though significantly reduced from 2020 levels, we continued to prudently utilize our COVID-19 Resident Hardship Program to provide direct financial relief to our residents suffering financial hardship and rent relief to students through our university partnerships.
•At the achievementproperty level, we continued our collaboration with RB, the makers of pre-establishedLysol and a global leader in hygiene products, to set the standard for cleanliness and disinfection at our student housing communities and promoted our “Be safe. Be smart. Do your part.TM” program. This includes a comprehensive review of cleaning products and procedures by a third-party hygiene and disinfectant
3
specialist that integrates enhanced cleaning standards, resident responsibility education and touchless preventative measures related to transactional, operational, financial and strategic objectives that served as the underlying assumptions in the Company’s stated earnings guidance, suchcollege communities across the country.
•We extended work-from-home and emergency leave measures.
•We made numerous advances in our ESG programs as growthoutlined in our Corporate Responsibility section.
Throughout the year, our ability to be resilient and adapt quickly to external changes was critical to the re-stabilization of net operating income ("NOI"), operating margin improvement,our operations despite the achievementchallenges presented by the global pandemic. We employed the enhanced capabilities of development yields, quality external growth, targeted joint ventures and/or dispositionsour newly developed operational systems to optimize mid-term academic year leasing to students making the decision to physically return to campus throughout the 2020-2021 academic year, resulting in our signing more spring and rental revenue growth.
In 2021, amidst ongoing challenges presented by the Compensation Committee to exercise discretion in rewarding actions that preserve long-term stockholder value while discouraging excessive risk-taking. The Compensation Committee and the independent membersglobal pandemic, we exceeded maximum targets for most of the Board believe that this equal weighting, between a fixed quantitative evaluation of performance and a more qualitative evaluation, provides the appropriate incentive structure and balance to drive long-term stockholder value and discourages excessive risk-taking. The Compensation Committee and the independent members of the Board will continue to evaluate the long-term incentive plan in the context of the overallour executive compensation program, business needsmetrics and feedback from stockholders.
•Despite industry-wide preleasing for the 2021-2022 academic year that was tracking significantly behind its traditional pace due to lingering COVID-19 uncertainty, achieved 95.8% opening fall occupancy and FFOM per share3.8% average rental rate growth over the prior year for the 2022 same store portfolio as of September 30, 2021, exceeding the high end of our guidance;
•Growing same store rental rate for the 17th consecutive year, measured as of September 30, 2021 versus 2020; • |
Outperforming our student housing peer set in the 2019/20202020-2021 academic year lease-up as detailed under 20192021 Long-Term Equity Incentive AwardsAwards;
•Returning same store net operating income (NOI) to pre-pandemic levels in the fourth quarter, one year earlier than anticipated, demonstrating the Company’s resiliency during the pandemic; •Growing same store NOI for 16 of 17 years as a public company (every year since 2004, except for 2020 which was significantly disrupted by the COVID-19 global pandemic); •Generating FFOM per share growth of 8.1%, as compared to the Company’s initial expectation of (2.5)% to 4.5%; • |
Delivering three new ownedphases of Flamingo Crossings Village, the Disney College Program (DCP) residential development, into service on-schedule and within its $210.8 million budget despite the national labor shortage and widespread supply chain constraints;
•Opening Flamingo Crossings Village to college program participants and moving in over 4,500 residents by Fall 2021, shortly after the Disney College Program recommenced in May 2021, following the program’s COVID-19 related pause;
•Commencing five new on-campus third-party development projects totaling $297.1since January 1, 2021, representing total fees to be recognized exceeding $24 million;
•Expanding the Company's successful public-private partnership business with university clients with four new awards for on-campus third-party development projects; and
•Forming a joint venture to own our eight-property Arizona State University student housing portfolio for aggregate proceeds of $551.3 million in investment into service at their collective underwritten yield, on-budgetas part of our strategic capital program to utilize joint venture and on-schedule
This discussion of the Company, its business and individual measures are used in assessing performance. These measures are discussed in the limited context of the executive compensation program. You should not interpret them as statements of the Company’s expectations or as any form of guidance. We caution you not to apply the statements or disclosures made in this Proxy Statement in any other context.
4
ü | DO align pay and performance by linking a substantial portion of compensation to the achievement of pre-established performance measures that drive | û | DO NOT base incentive awards on a single performance measure, thereby discouraging unnecessary or excessive risk-taking | |||||||||||
| ü | DO provide executive officers with the opportunity to earn market-competitive compensation through a mix of cash and equity compensation, with strong emphasis on performance-based incentive awards | û | DO NOT provide guaranteed minimum payouts or uncapped award opportunities | |||||||||||
| ü | DO have a robust peer selection process and benchmark executive compensation to target the median of the comparative group of peer companies | û | DO NOT reprice or permit cash buyouts of underwater stock options | |||||||||||
| ü | DO require executive officers and directors to own and retain shares of common stock that have significant value to further align interests with | û | DO NOT provide executive officers with excessive perquisites or other personal benefits | |||||||||||
| ü | DO enhance alignment with long-term shareholder value and executive officer retention with 5-year vesting schedules for equity incentive awards earned for prior-year performance | û | DO NOT provide executive officers with pension or retirement benefits other than pursuant to a 401(k) plan and a deferred compensation plan | |||||||||||
| ü | DO enable the Board to “claw back” incentive compensation in the event of an accounting restatement due to material non-compliance with financial reporting requirements as a result of misconduct by executive officers | û | DO NOT permit executive officers or directors to engage in derivative or other hedging transactions in the Company’s securities | |||||||||||
| ü | DO prohibit new tax gross-up arrangements under anti-tax gross-up policy | û | DO NOT provide accelerated vesting upon a change of control under the 2018 Incentive Award Plan | |||||||||||
| ü | DO maintain a Compensation Committee comprised solely of independent directors | û | DO NOT provide single-trigger change of control benefits | |||||||||||
| ü | DO engage an independent compensation consultant to advise the Compensation Committee on executive compensation matters and establishing an appropriate peer group | û | DO NOT permit executive officers and directors to hold the Company's securities in margin accounts or to otherwise pledge the securities to secure loans | |||||||||||
Corporate Responsibility / ESG
Corporate responsibility is fundamental to the Company’s mission to consistently provide every resident and team member with an environment conducive to healthy living, personal growth, academic achievement and professional success. This mission drives our ESG (environmental, social and governance) vision of creating healthy, sustainable environments with a sense of community and connection by giving back, investing in our employees and driving long-term value for all stakeholders.
Our core products and services directly further some of the most important of all ESG values. For example:
•We have developed 37 Leadership in Energy and Environmental Design (LEED) certified student housing projects – these promote sustainability and operating efficiency, thereby reducing recurring operating and capital expenses, and fill a growing demand for LEED-certified buildings:
•We promote walkability by prioritizing proximity to campus in our development and acquisition criteria, thus reducing emissions and noise – nearly 95% of our owned communities are located within a half mile from campus, so students can easily walk or bike to campus;
•We continuously evaluate opportunities to perform efficiency upgrades that both reduce energy and water consumption and provide financial returns;
•We strive to make high-quality student housing affordable for students from all backgrounds without sacrificing location, quality or service;
•We promote an “open-door” culture where every employee should feel comfortable approaching their peers and leadership with questions or feedback;
5
•We support our residents’ mental health via our long-term partnership with the Hi, How Are You Project and staff training on peer-to-peer support at 200+ communities across the country; and
•We foster environments with a sense of community and connection by regularly surveying our employees and residents and creating programs and practices that promote achievement and wellbeing.
We support these important value-adding ESG practices by, among other things:
•Regularly reviewing ESG initiatives and results with our Board of Directors
•Employing significant internal resources including appointing a new Executive Vice President and Chief Purpose and Inclusion Officer, Senior Vice President of Corporate Responsibility, and Director of ESG, and forming both a multi-functional ESG Committee and a Diversity and Inclusion Task Force to support and enhance our programs and goals and to ensure we execute on our ESG strategy
•Selecting the Sustainability Accounting Standards Board’s (SASB) standards as our ESG guidance framework, which we plan to report against in our upcoming 2021 Corporate Sustainability Report
•Planning for entity-level ESG goalsetting and climate risk analysis in 2022, as we endeavor to report in line with the Task Force on Climate-Related Financial Disclosures (TCFD) framework in the future
•Maintaining communication with ESG-focused stakeholders
•Publishing our annual Corporate Sustainability Report at ESG.americancampus.com
•Engaging stakeholders and executing an ESG materiality analysis, and benchmarking our ESG progress against our peers
•Amending our $1.0 billion unsecured revolving credit facility to incorporate sustainability goals to promote the awareness and achievement of ESG performance targets each year (with a performance target in each pillar of E, S, and G)
•Engaging third-party experts to help us develop ambitious usage reduction targets, perform a climate and transition risk scenario analysis, and monitor and report on our progress
•Engaging experts to perform property audits and analyzing energy, water, and waste data to identify opportunities to implement energy and water saving retrofits
•Performing environmental due diligence on all acquisitions and development properties based on LEED specifications
•Annually report our greenhouse gas (GHG) emissions and company demographic and diversity metrics
•Contracting to source 10.3m kWh of electricity from renewable energy
•Implementing business development outreach programs to broaden our network of minority and women-owned businesses for development projects
•Contributing to a scholarship fund at Prairie View A&M University, a Historically Black College and University (HBCU) and committing to a $5.0 million donation to Arizona State University to support student scholarships and sustainability initiatives on the campus
•Publishing a summary of our Human Rights policies
•Engaging local businesses by developing a neighborhood small business nurturing program to attract and support disadvantaged and underrepresented business owners in our owned portfolio
Our company values are centered around people. We care deeply about our residents and serving students well requires engaged, passionate, and diverse team members, so we’ve created an award-winning culture that fosters growth and rewards achievement. We achieve these efforts by, among other things:
•Engaging with our employees through regular communication and by soliciting valuable feedback on our efforts to create a healthy and meaningful work culture, including:
◦Annually surveying our employees regarding their satisfaction and views on the workplace environment
◦Publishing a monthly newsletter that welcomes new team members, highlights employee advancement, celebrates life events, and promotes company milestones and achievements
◦Founding a Culture Committee which promotes company-wide initiatives and togetherness
◦Providing a quarterly update to all property and corporate employees, highlighting employee accomplishments, operational best practices, upcoming events and other Culture Committee initiatives
◦Conducting “Bill’s Quarterly Call”, a CEO update event where every employee in the company can ask questions to leadership regarding the company’s direction and the state of the industry
◦Maintaining a digital suggestion box on the company intranet site for employees to offer ideas and feedback on all aspects of the company
•Becoming a signatory of the CEO Action for Diversity & Inclusion pledge
•Forming a diversity and inclusion (D & I) task force to oversee the execution of our goals over the long-term
6
•Conducting “Unconscious Bias/Business Training” for employees and collaborating with our consultant to develop D&I training curriculum for employees and supervisors including:
◦The Benefits of Diversity, Equity, & Inclusion
◦Empathy, Sensitivity, & Inclusion
◦Overcoming Unconscious Bias in the Workplace
•Demonstrating our commitment to protecting our team members and residents during the pandemic by rapidly adopting protective objectives and guidelines, as detailed under COVID-19 Response
•Promoting training and professional development to provide the training necessary to further employee effectiveness and assist in career advancement and retention
•Supporting a culture of developing future leaders from our existing workforce, enabling us to promote from within for many leadership positions
•Emphasizing safety by creating an environment where every supervisor is expected to devote the time and effort necessary to ensure the safety of employees at all times, including proper work methods, reporting potential hazards and abating known hazards
•Developing a comprehensive “Product Health and Safety Plan” that includes safety-related work practices that apply to our student housing communities and include:
◦Safety rules and safe job procedures
◦Safety meetings and training sessions
◦Keeping work areas clean and free from slipping or tripping hazards
◦Immediately reporting all malfunctions to a supervisor
◦Using care when lifting and carrying objects
◦Observing restricted areas and all warning signs
◦Knowing emergency procedures
◦Reporting unsafe conditions to supervisors
◦Promptly reporting every accident and injury
◦Following the proposal to ratifycare prescribed by the appointmentattending physician when treated for an injury or illness
◦Participating in accident investigations, serving on safety committees or other loss control activities
•Requiring service contract agreements, mandating that all contractors and subcontractors that perform work in facilities or on property controlled by ACC abide by all safety rules and follow safety procedures
•Maintaining contractor safety training records that are accessible for review by property staff
Our ESG leadership has been recognized. We have been:
•An honoree of independent registered public accountants is considered a “discretionary” item. This means that brokerage firms may vote in their discretion on this matter on behalf of clients who have not furnished voting instructions at least ten days before the dateTexan by Nature 20 (TxN20), an official ranking of the meeting.top 20 companies in Texas for our leadership and commitment to conservation and sustainability
•A recipient of the Great Place to Work™ certification - with 97% of the employees surveyed saying ACC is a great place to work
We are committed to diversity and inclusion and became a signatory of the CEO Action for Diversity & Inclusion pledge, as noted above. Our Company and our student communities are defined and strengthened by the principle that every individual and their experience adds value and enhances our position as an industry leader and university partner. Through diversity and inclusion, we create and maintain a workplace environment that supports the development and advancement of all team members from all backgrounds. As of December 31, 2021:
•44% of our independent directors, including the Board Chair, self-identify as women or people of color.
•Our total workforce self-identifies as 50% female, 48% male, and 2% unspecified and 45% White, 21% Black, 24% Hispanic/Latino, 5% Asian and 5% Other. “Other” includes American Indian, Alaska Native, Native Hawaiian, Pacific Islander, Not Specified or two or more races.
•Our management team (team members with the title of general manager or higher job classifications) self-identifies as 56% female and 44% male and 67% White, 12% Black, 13% Hispanic/Latino, 4% Asian and 4% Other.
•Our executive management team was represented by individuals who self-identify as female (33%) and minority (22%), both having increased by over 10 percentage points during the year.
7
Additional information regarding the Company’s ESG initiatives may be found online at ESG.AmericanCampus.com (although none of the information on the Company’s website is incorporated into this Proxy Statement by reference).
COVID-19 Response
While the Company’s crisis management structure and approach prepare us to effectively address emergency incidents, the COVID-19 pandemic presented itself as a unique challenge.
During 2021, management met on a regular basis to discuss the ongoing impacts of COVID-19 on the Company, including on the Company’s financial position and results of operations, as well as matters including health safeguards, resident programs, community operations, communications to tenants and infrastructure.
In response to the pandemic, in March 2020, the Company implemented eight principle objectives as guidelines to follow during the pandemic:
•Strive to maintain a healthy and academically oriented environment for the Company’s residents by adopting and implementing all CDC guidelines with regard to cleaning, sanitization, and social distancing as the Company continues to deliver essential services, and ensure that the Company’s state of the art broadband service continues to be reliable to facilitate the delivery of online education as universities move to that medium to deliver classroom lectures;
•Be compassionate and provide financial assistance and support to residents and their discretion,families who suffer a diminishment of income as a result of the proxy holdersCOVID-19 crisis;
•Strive to ensure that all American Campus Communities team members have a safe, healthy and productive work environment as they continue to deliver services to the Company’s residents and university partners and as they continue to construct and deliver the Company’s development projects;
•Work with the Company’s university partners to understand their individual unique challenges with regard to COVID-19 and assist them in implementing their plans and accomplishing their objectives. Anyone can be a good partner when things are authorizedgoing well – our goal is to votedemonstrate that we are a good partner in times of crisis such as this;
•Attempt to limit all negative financial and operational impacts to the period directly associated with this crisis and work to prevent negative financial impacts from carrying forward into the Company’s stabilized business model or from negatively impacting long-term valuations for the Company’s portfolio and sector;
•Adapt the Company’s marketing and leasing strategies to successfully complete the fall lease-up and work collaboratively with all the universities the Company serves in an attempt to return to a state of normalcy, stability and “business as usual” for the 2021-2022 academic year;
•Ensure the necessary balance sheet liquidity to withstand the duration of the crisis; and
•Reflect on the challenges faced during this black swan event and take note of the lessons learned, in an effort to be better prepared for a future pandemic or other unanticipated event to improve the Company’s future products, services and operational policies, as well as to advance and refine the Company’s investment and capital allocation strategies, transaction structures and underwriting standards.
Early in the pandemic, the Company made a pledge that every resident would have a home, regardless of their ability to pay, and formed a COVID-19 Resident Hardship Program which provided direct financial relief to our residents suffering financial hardship and relief to students through our university partnerships. In addition to this financial assistance, the Company also waived all late fees and online payment fees and suspended financial related evictions during the spring and summer terms of 2020, and in certain cases continued to do so during 2021.
We supported our employees and residents at the property level by collaborating with RB, the makers of Lysol® and a global leader in hygiene products, to set a new standard and formalized approach to cleanliness and disinfection at our student housing communities. We also launched a “Be safe. Be smart. Do your part.TM” program, which includes a comprehensive review of cleaning products and procedures by a third-party
8
hygiene and disinfectant specialist that integrates enhanced cleaning standards, resident responsibility education and touchless preventative measures in the Company’s college communities across the country. We also assisted our team members by adopting pervasive work-from-home and emergency leave measures for our employees.
9
BACKGROUND OF THE SOLICITATION
The following discussion provides background information regarding our interactions with Land & Buildings Investment Management, LLC and its affiliates and representatives (collectively, “Land & Buildings”) during 2020, 2021 and 2022.
In November 2020, Jonathan Litt, the Founder and Chief Investment Officer of Land & Buildings, contacted Edward Lowenthal, the then Chair of the Board, and Cydney Donnell, a member of the Board and the current Chair of the Board, to discuss certain valuation, operational and governance matters. On November 24, 2020, Mr. Lowenthal, Ms. Donnell and Mary Egan, the Chair of the Strategic Planning and Risk Committee, met by videoconference with Mr. Litt and Corey Lorinsky, an employee of Land and Buildings, to discuss various matters related to the Company, including those relating to valuation. On December 2, 2020, Ms. Egan, John Rippel, a member of the Board, William Bayless, our Chief Executive Officer, and Daniel Perry, our Chief Financial Officer, met by video conference with Messrs. Litt and Lorinsky to discuss, among other things, the Company’s valuation, operations and strategic objectives.
On December 8, 2020, Land & Buildings submitted a notice to the Company regarding its intent to nominate three people for election to the Board at the 2021 annual meeting.
From December 2020 through January 2021, the Nominating and Corporate Governance Committee, as part of its ongoing board refreshment efforts, conducted a search process for additional independent directors. During this time, the Nominating and Corporate Governance Committee considered 14 candidates and conducted interviews with nine of these candidates, including the three Land & Buildings nominees. After the consideration of the professional experience, skills, personal attributes, including those relating to diversity, the Nominating and Corporate Governance Committee concluded that Herman Bulls, Alison Hill and Craig Leupold, three of the candidates identified by the Company, each had significantly stronger qualifications to serve on the Company’s board than did any other mattersof the nominees identified by Land & Buildings.
During this same period, representatives of the Company and the Board held discussions with Mr. Litt regarding his views on board composition matters.
On January 27, 2021, the Company entered into a Cooperation Agreement with Land & Buildings. In connection with entering into the Cooperation Agreement, the Company paid $450,000 to Land & Buildings as a reimbursement of its costs, and the Board appointed Messrs. Bulls and Leupold and Ms. Hill to the Board and established a Capital Allocation Committee, of four members: Mr. Leupold, who is the Chair, Ms. Hill, Ms. Donnell and Mr. Rippel. Also on January 27, 2021, the Company announced that may properly come beforeMr. Lowenthal, having met the Company's mandatory retirement age, would retire as Chair of the Board, effective as of the conclusion of the 2021 Annual Meeting, at which time Ms. Donnell will become the Chair of the Board, and Carla Piñeyro Sublett resigned from the Board effective immediately in connection with an upcoming change in her principal occupation.
During 2021, the Company’s management and Board and its committees focused its time and efforts on the re-stabilization of operations despite the challenges presented by the global pandemic, resulting in the Company accomplishing significant financial and strategic objectives and milestones described in “Summary-2021 Performance Amidst a Global Pandemic.” Also during 2021, the Board received quarterly “Progress Report” videos from Land & Buildings.
In late October, 2021, Mr. Litt scheduled a call with Ms. Donnell and Mr. Leupold to discuss the Company’s year-to-date performance. On November 1, 2021, Mr. Litt sent a letter to Ms. Donnell and Mr. Leupold regarding valuation, operational and governance matters, and informing the Company that Land & Buildings intended to nominate Mr. Litt for election to the Board at any postponement or adjournment thereof. Thethe 2022 Annual Meeting.
By letter dated November 5, 2021, Ms. Donnell informed Mr. Litt that she had shared the November 5 letter with the Board, knowsand noted that a meeting had been scheduled with Land & Buildings to discuss its perspective regarding the Company’s net asset value (NAV) and that Oliver Luck, Chair of no otherthe Nominating & Corporate Governance Committee, would be contacting Mr. Litt to schedule a meeting regarding Mr. Litt joining the Board.
On November 8, 2021, a meeting was held by videoconference with Messrs. Litt, Lorinsky, Ms. Donnell and Messrs. Leupold, Rippel and Perry regarding valuation matters and assumptions underlying Land & Buildings’ analysis of the Company’s NAV.
10
On November 9, 2021, Mr. Litt sent a letter to the Company stating that he believed the principal difference in the NAV calculations of the Company and Land & Buildings was the starting point of the analysis, without further amplification.
On November 18, 2021, Mr. Litt met with the Nominating and Corporate Governance Committee and Ms. Donnell by video conference to discuss him joining the Board. During this discussion, Mr. Litt agreed to provide the Committee with two items of businessadditional information:
1.Case studies demonstrating that willsubstantial sales of up to half a company’s assets, as he had suggested for the Company, as an effective means of enhancing public market valuation and eliminating any discount to Net Asset Value.
2.Which shareholders of the Company were supportive of Land & Buildings’ proposed asset-sale strategic plan and Mr. Litt’s participation on the Company’s Board. As the Company representatives communicated to Mr. Litt, the Company had not heard support for this asset-sale strategy from shareholders, despite extensive shareholder engagement, and therefore asked Mr. Litt to provide a channel for the Board to speak directly to those shareholders who supported this strategy, and he indicated he would “clear it with them and get back to us.”
On November 19, 2021, Mr. Luck sent an e-mail to Mr. Litt thanking him for his time and reminding Mr. Litt to provide these items.
On November 23, 2021, Mr. Litt responded to Mr. Luck’s email requesting that his nomination to the Board be presentedresolved by the end of the following week. This communication did not address the provision of the additional items of information.
On December 13, 2021, Land & Buildings issued a press release announcing that it had sent an open letter to the Company’s shareholders and would be hosting a conference call on December 16, 2021 to discuss the contents of its letter.
On December 16, 2021, the Company issued a press release announcing that it had issued an open letter to its shareholders that (1) disclosed that the Company’s Board and members of management have each recently met with representatives of Land & Buildings, (2) detailed the Company’s performance and Board refreshment and (3) reiterated the commitment of the Board and management team to enhancing value for consideration atall shareholders of the Annual Meeting other thanCompany. Copies of the proposals describedpress release and letters to and from Land and Buildings to certain members of the Board are attached as exhibits to the Current Report on Form 8-K filed by the Company with the SEC on December 16, 2021.
Also on December 16, 2021, Land & Buildings hosted a webcast and issued a website presentation regarding the Company. During the webcast, Mr. Litt stated that he did not believe that any independent member of the Board had any public REIT management experience, when in this Proxy Statement. In addition, no stockholder proposals or nominations were received onfact Messrs. Rippel and Dawson and Ms. Hill all have served as senior executives of publicly-traded REITs, and that the Company needed a timely basis, so no such matters may be broughtrevenue management system, while various of the Company’s public filings have detailed disclosure regarding our historical leasing and revenue management systems as well as our newly-implemented enterprise resource planning system.
On December 17, 2021, Land & Buildings sent a letter to the Company nominating Mr. Lorinsky as a votenominee for election to the Board at the Annual Meeting.
On January 5, 2022, Ms. Donnell and Mr. Luck sent a letter to Mr. Litt expressing disappointment that Land & Buildings had launched a public campaign while discussions were ongoing regarding the evaluation of his candidacy, and surprise that given his stated intent to join the Board, he had nominated Mr. Lorinsky as Land & Buildings’ candidate. In this letter, Mr. Litt was informed that after careful consideration of Mr. Lorinsky’s experience and qualifications, as well as the numerous prior engagements and interactions members of the Board have had with Mr. Lorinsky over the past year, the Board had determined that it does not believe Mr. Lorinsky will be an additive member of the Board and did not intend to move forward with his candidacy, and requesting that Land & Buildings withdraw its director nomination and continue to engage privately and constructively with the Company’s Board and management team.
On January 18, 2022, the Company received another letter from Land & Buildings in which Mr. Litt demanded that he or his colleague be added to the Board, saying, “Both myself (sic) and Corey Lorinsky, my partner of over ten years, are uniquely qualified to be on the Board of ACC and we remain open to resolving the nomination.”
On January 19, 2022, Ms. Donnell responded to Mr. Litt by email on behalf of the Board confirming receipt of the January 18 letter and confirming that as previously communicated, the Board has concluded that Mr. Lorinsky, the candidate Land & Buildings nominated to stand for election, lacks the requisite qualifications to serve on the Board.
11
On February 15, 2022, the Company received a letter from Land & Buildings in which Land & Buildings stated it is “indicating its willingness to offer to acquire” the Company for $57.00 per share.
On February 16, 2022, the Company issued a press release (1) disclosing that the Company had received a nomination from Land & Buildings of Mr. Lorinsky, (2) providing an update on the Company’s extensive engagement with Land & Buildings, including the receipt of the February 15 letter with what was characterized in such press release as a “faux bid” tactic in light of Land & Buildings’ lack of capital capacity and demonstrated transaction experience to execute an acquisition of the Company, and (3) reiterating the commitment of the Board and management team to enhancing value for all shareholders of the Company. Copies of the press release and letters to and from Land and Buildings to certain members of the Board are attached as exhibits to the Current Report on Form 8-K filed by the Company with the SEC on February 16, 2022.
On February 28, 2022, Ms. Donnell and Mr. Leupold received a letter from Land & Buildings in which Land & Buildings, among other things, requested the execution of a non-disclosure agreement (NDA) prior to disclosing the identity of its financial advisor, which form did not include generally customary provisions, such as a standstill and restrictions on broadly “shopping” the Company's sensitive, confidential information. By letter dated March 1, 2022, Ms. Donnell requested information regarding Land & Buildings’ sources and uses of funding, stated that the execution of an NDA is not a prerequisite for the provision of this information, and informed Land & Buildings that the Board did not believe the proposed price appropriately valued the Company. Copies of these letters are attached as exhibits to the Current Report on Form 8-K filed by the Company with the SEC on March 4, 2022.
On March 14, 2022, representatives of BofA Securities, the Company’s financial advisor, and Dentons US LLP, the Company’s legal advisor, contacted counsel to Land & Buildings, as a courtesy, to inform them that the Company intended to shortly file this preliminary proxy statement with the SEC and to inquire as to whether Land & Buildings intended to proceed with its nomination of Mr. Lorinsky to the Company’s Board. Land & Buildings’ counsel informed the Company’s representatives that they would respond after discussing. As of the afternoon of March 15, 2022, there was no response.
On March 15, 2022, the Company filed this preliminary proxy statement with the SEC.
12
GOVERNANCE OF THE COMPANY
Board Composition and Refreshment
The Nominating and Corporate Governance Committee seeks directors with established strong professional reputations and experience in areas relevant to the strategy and operationsperforms an assessment of the business. Each ofskills and the nominees for election as a director atexperience needed to properly oversee the Annual Meeting holds or has held senior executive positions in large, complex organizations and has experience that meets this objective, as described below. In these positions, they have also gained experience in core management skills, such as strategic and financial planning, public company financial reporting, compliance, risk management and leadership development. Each director also has experience serving on or advising boards of directors and board committees of other organizations and has an understanding of corporate governance practices and trends.
exercising its oversight function. The Nominating and Corporate Governance Committee also believes that eachthen compares those skills to the skills of the nominees has other key attributes that are important to an effective board: integrity, candor, analytical skills, the willingness to engage managementcurrent directors and each other in a constructive and collaborative fashion, and the ability and commitment to devote significant time and energy to serve on the Board and its committees.potential director candidates. The Nominating and Corporate Governance Committee takes into account diversity considerations (as discussedconducts targeted efforts to identify and recruit individuals who have the qualifications identified through this process.
Thoughtful consideration is continuously given to the composition of our Board in order to maintain an appropriate mix of experience, qualifications and attributes, introduce fresh perspectives, and broaden and diversify the views and experience represented on the Board. As a result of our focus on refreshment, we added three new directors to our Board in early 2021. The average tenure of our independent Board nominees is currently approximately 7 years.
The table below in “Board Diversity”) in determiningsummarizes the key qualifications, skills, and attributes most relevant to the decision to nominate candidates to serve on the Board. A mark indicates a specific area of focus or expertise on which the Board particularly relies. The absence of a mark does not mean the director nomineesdoes not possess that qualification or skill. Our director nominees’ biographies describe each director’s background and planning for director successionrelevant experience in more detail.
| Qualifications, Expertise and Attributes | Bill Bayless | Herman Bulls | Steve Dawson | Cydney Donnell | Mary Egan | Alison Hill | Craig Leupold | Oliver Luck | Pat Oles | John Rippel | ||||||||||||||||||||||
| Board Diversity | ||||||||||||||||||||||||||||||||
| Representation of gender and/or ethnic diversity | l | l | l | l | ||||||||||||||||||||||||||||
| Real Estate | ||||||||||||||||||||||||||||||||
| Significant background working in real estate, resulting in knowledge of public and private capital, how to anticipate trends, generate returns or create capital allocation models | l | l | l | l | l | l | l | l | ||||||||||||||||||||||||
| University Relations | ||||||||||||||||||||||||||||||||
| Experience cultivating and sustaining business relationships with universities | l | l | l | l | l | |||||||||||||||||||||||||||
| Leadership | ||||||||||||||||||||||||||||||||
| Has overseen the execution of important strategic, operational and policy issues while serving in an executive or senior leadership role | l | l | l | l | l | l | l | l | l | l | ||||||||||||||||||||||
| Strategic Transactions | ||||||||||||||||||||||||||||||||
| A history of leading growth through acquisitions, business combinations, strategic partnerships or other transactions | l | l | l | l | l | l | l | l | l | l | ||||||||||||||||||||||
| Financial Literacy | ||||||||||||||||||||||||||||||||
| Knowledge of financial markets, financing operations, complex financial management and accounting and financial reporting processes | l | l | l | l | l | l | l | l | l | l | ||||||||||||||||||||||
| Capital Allocation | ||||||||||||||||||||||||||||||||
| Experience in the distribution and investment of an enterprise's financial resources to maximize returns to stakeholders | l | l | l | l | l | l | l | l | l | l | ||||||||||||||||||||||
| Public Company Executive | ||||||||||||||||||||||||||||||||
| Has served as a senior officer of a public company | l | l | l | l | l | |||||||||||||||||||||||||||
| Enterprise Human Capital Management | ||||||||||||||||||||||||||||||||
| Enterprise-wide experience in recruiting, managing, developing and optimizing an entity’s human resources | l | l1 | l | l | l | l | l | l | l | l | ||||||||||||||||||||||
(1)Qualifications, attributes and believes that, as a group, the nominees bring a diverse range of perspectives to the Board’s deliberations. Each of the nominees, other than Mr. Bayless, is independent of the Companyexpertise includes direct experience with diversity, equity and its management.
inclusion.
13
| Independence | 90% | 10% | |||||||||||||||||||||||||||||||||
| Racial, ethnic or gender diversity | 40% | 60% | |||||||||||||||||||||||||||||||||
Financial expertise (1) | 80% | 20% | |||||||||||||||||||||||||||||||||
| < 3 years | 3 - 7 years | >7 years | |||||||||||||||||||||||||||||||||
| Tenure | 3 | 3 | 4 | ||||||||||||||||||||||||||||||||
| < 60 years | 60 - 65 years | > 65 years | |||||||||||||||||||||||||||||||||
| Age | 4 | 3 | 3% | ||||||||||||||||||||||||||||||||
| (1) As such term is defined in item 407(d)(5)(ii) of Regulation S-K | |||||||||||||||||||||||||||||||||||
| Independence | 89% | 11% | ||||||||||
≤ 5 years | 5 - 10 years | > 10 years | ||||||||||
| Tenure | 3 | 2 | 4 | |||||||||
| Female | Male | |||||||||||
| Gender diversity | 33% | 67% | ||||||||||
| Ethnic diversity | 11% | 89% | ||||||||||
| <50 | 50-60 | 60-70 | 70+ | |||||||||
| Age | 1 | 4 | 3 | 1 | ||||||||
Financial expertise (1) | 56% | 44% | ||||||||||
| (1) As such term is defined in item 407(d_(5)(ii) of Regulation S-K | ||||||||||||
 | Experience •Executive Vice President and Chief Operating Officer of the predecessor entities •Director of Operations, •Director of Marketing, •Began his career | ||||||||||||||||
William C. Bayless, Jr. Age: 57 CEO & Director since Committees: Executive | Qualifications •Ability to lead the •Detailed knowledge, | ||||||||||||||||
 | •B.S., Business Administration, West Virginia University | ||||||||||||||||
•Advisory Board, Amherst Holdings, LLC (since June 2018) | |||||||||||||||||
14
 | Experience •Vice Chairman, Americas; International Director and the founder of the Public Institutions Business Unit, JLL; joined 1989 and worked in the areas of development, investment management, asset management, facilities operations and business development/retention. •Co-founder, President and CEO, Bulls Capital Partners, a Fannie Mae multi-family financing company (former) •Founder, Bulls Advisory Group, LLC, a management and real estate advisory firm (former) •Selected by the Secretary of Veteran Affairs under President Obama to serve as a member of the MyVA Advisory Committee, whose mission was to advise the Secretary on the modernization of VA's culture, processes, and capabilities in order to put the needs, expectations, and interests of Veterans and beneficiaries first. •Completed almost 12 years of active-duty service with the United States Army; last active-duty assignments were working in the Office of the Assistant Secretary of the Army for Financial Management at the Pentagon and as an Assistant Professor of Economics and Finance at West Point; completed the Army's Airborne, Ranger and Command and General Staff College courses and served overseas in the Republic of Korea; retired as a Colonel in the U.S. Army Reserves in 2008. | |||||||||||||
Herman E. Bulls Age: 66 Director since 2021 Committees: Strategic Planning and Risk | ||||||||||||||
Qualifications •Experience in real estate investment and development; real estate operation; real estate capital allocation; strategic planning; corporate governance; higher education; business development and leadership; diversity and inclusion | ||||||||||||||
Education •B.S., Engineering, United States Military Academy at West Point •M.B.A., Finance, Harvard Business School | ||||||||||||||
• •Director, Comfort Systems, USA (NYSE: FIX) •Chairman, Fluence Energy (NASDAQ: FLNC) | ||||||||||||||
Prior Public Boards •Director, Computer Sciences Corporation (CSC) (2015 – 2017) | ||||||||||||||
Non-Public Boards •Director, Collegis Education •Vice Chairman, USAA •Member, Real Estate Advisory Committee for New York State Teachers' Retirement System •Member, American Red Cross National Board of Governors •Vice Chairman, West Point Association of Graduates •Chairman, Fannie Mae National Housing Advisory Council (former) | ||||||||||||||
15
 | Experience •Private investor focused on real estate, •Chief Financial Officer, | |||||||||||||
Qualifications •Experience in financial reporting, accounting and controls; REIT management; real estate operations, investment and development | ||||||||||||||
Education •B.B.A., Accounting, Texas A&M University | ||||||||||||||
G. Steven Dawson Age: 64 Director since 2004 Committees: Audit, Compensation | ||||||||||||||
Other Public Boards •Cohen & Co. (NYSE American: COHN), a financial services firm specializing in fixed income and structured credit securities trading, securitizations, management, •Medical Properties Trust (NYSE: MPW), a hospital/healthcare REIT with hospital properties in the U.S., Australia, Europe and •Nova Net Lease REIT (CSE: NNL-U.CN), a | ||||||||||||||
Non-Public Boards •Real Estate Roundtable, | ||||||||||||||
 | ||||||||||||||
 | Experience •Former Principal and Managing Director, •Real Estate Lending Officer, RepublicBanc Corporation in Dallas | ||||||||||||||||
Cydney Age: 62 Chair of the Director since 2004 Committees: Executive, Capital Allocation | Qualifications •Experience in financial investment and services; REITs; corporate governance; university operations; strategic planning | ||||||||||||||||
Education •B.B.A., Texas A&M University •M.B.A., Southern Methodist University | |||||||||||||||||
Other Public Boards •Pebblebrook Hotel Trust (NYSE:PEB), a hotel REIT | |||||||||||||||||
Non-Public Boards •Board of Trustees, •Board of Directors, •Employees Retirement System of Texas Board of Trustees, appointed by Governor Rick Perry •Board and Institutional Advisory Committee of the National Association of Real Estate Investment Trusts, or | |||||||||||||||||
 | |||||||||||||||||
16
 | Experience •Founder and •Head of Global Strategy, Starbucks (2010 – 2012) •Partner and Managing Director, The Boston Consulting Group (1996 – 2010) | ||||||||||||||||
Qualifications •Experience in | |||||||||||||||||
Mary Age: 54 Director since 2018 Committees: Compensation, Strategic Planning and Risk | Education •B.A., Barnard College, Columbia University •M.B.A., Columbia University Graduate School of | ||||||||||||||||
Other Public Boards •Noodles & Company (NASDAQ: NDLS), a fast-casual restaurant | |||||||||||||||||
 | |||||||||||||||||
 | Experience •Managing Director, Strategic Capital, Prologis (NYSE: PLD), where she was responsible for the •Served in a variety of •Practiced real estate law at the global law firm of Morrison & Foerster •Practiced law with Lionel Sawyer & Collins within the real estate and | ||||||||||||||||
Alison M. Hill Age: 56 Director since 2021 Committees: Capital Allocation, Compensation | Qualifications •Experience in real estate investment and | ||||||||||||||||
Education •B.A., •J.D., | |||||||||||||||||
 | •The SWIG Company, a San Francisco based privately owned real estate investor and operator •GirlVentures, a San Francisco-Bay area based non-profit that inspires girls to lead through outdoor adventure, inner discovery and collective action •Board of Trustees, Hamilton College | ||||||||||||||||
17
 | Experience •President and Chief Executive Officer, Green Street Advisors, Inc., a commercial real estate, news, data, analytics and advisory services firm (2008 – 2020); joined in 1993 •Real estate consultant, Kenneth Leventhal and Company •Commercial real estate lender, Union Bank of California | ||||||||||||||||
Qualifications •Experience in real estate investment and development; REIT management; real estate operations, real estate capital allocation; business development and leadership | |||||||||||||||||
Craig A. Leupold Age: 59 Director since 2021 Committees: Capital Allocation, Executive, Nominating and Corporate Governance | |||||||||||||||||
Education •B.A., University of California, San Diego •M.B.A., Finance and Real Estate, Columbia University Graduate School of Business | |||||||||||||||||
 | Experience •Private investor •Chief Executive Officer and Commissioner, XFL (2018 – 2020) (*On April 13, 2020, Alpha Entertainment LLC, the owner of the XFL, •Athletic Director, •President/General Manager, •Chief Executive Officer, •Served in a variety of positions, including Vice President of Business Development and President and Chief Executive Officer of NFL •Quarterback, Houston Oilers (1982 – 1986) | |||||||||||||
 | ||||||||||||||
Oliver Luck Age: 62 Director since 2012 Committees: Nominating and Corporate Governance, Strategic Planning and Risk | ||||||||||||||
Qualifications •Experience in university management; business development and leadership; law | ||||||||||||||
Education •B.A., West Virginia University •J.D., University of Texas School of Law | ||||||||||||||
Non-Public Boards •Member, National Football League Player Safety Advisory Panel •Member, College Football Playoff Selection Committee (former) •Served in various capacities in a number of university and community associations (former) | ||||||||||||||
18
 | Experience •McCoy Professorship for Studies in Entrepreneurship, McCoy College of •Director of Governmental Appointments for Governor of Texas, William P. Clements, Jr. (1980 – 1982) | ||||||||||||||||
Qualifications •Experience in real estate investment and development; governmental interactions; higher education service and relationships | |||||||||||||||||
C. Patrick Oles, Jr. Age: 67 Director since 2014 Committees: Audit, Executive, Nominating and Corporate Governance | Education •B.B.A., | ||||||||||||||||
Non-Public Boards •Senior Advisor, SouthWest Water Company, a privately-owned provider of water and wastewater services •Vice President of •Chair, •Board of Directors, Lower Colorado River Authority (former) •Founding member and Chairman of the •Member of the Advisory Board of Directors, JPMorgan Chase (former) •Trustee, Texas Nature Conservancy (former) | |||||||||||||||||
 | |||||||||||||||||
 | Experience •President and Chief Operating Officer, Gables Residential (1994 – 1999) •Partner in •CPA, | ||||||||||||||||
Qualifications reporting | |||||||||||||||||
 | |||||||||||||||||
John T. Rippel Age: 67 Director since 2018 Committees: Audit, Capital Allocation | |||||||||||||||||
Education | ||||||||||||
 | ||||||||||||
19
Board Independence and Meetings
Board Governance DocumentsDocuments. . The Board maintains charters for all committees. In addition, the Board has adopted a written set of corporate governance guidelines and a code of business conduct and ethics. To view the committee charters, corporate governance guidelines and code of business conduct and ethics, please visit www.AmericanCampus.com. The Board has adopted and adheres to corporate governance practices that the Board and senior management believe promote the highest standards of integrity, are sound and represent best practices. The Board of Directors periodically reviews these governance practices, the rules and listing standards of the New York Stock Exchange and SEC regulations, as well as best practices suggested by recognized governance authorities.
Independence. . There are nineten nominees for director. The Board of Directors has determined, after considering all of the relevant facts and circumstances, that eightnine nominees (Messrs. Bulls, Dawson, Lowenthal,Leupold, Luck, Oles and Rippel, and Ms.Mses. Donnell, Ms. Egan and Ms. Piñeyro)Hill) are independent, as “independence” is defined by the New York Stock Exchange. This means that none of the independent directors has any direct or indirect material relationship with the Company, either directly or as a partner, stockholdershareholder or officer of an organization that has a relationship with the Company. As a result, the Board has a majority of independent directors on the Board as required by the listing requirements of the New York Stock Exchange.
Executive SessionsSessions. . Non-employee directors have regularly scheduled executive sessions in which they meet without the presence of management or management directors. These executive sessions typically occur before or after each regularly scheduled meeting of the Board of Directors. Any independent director may request that an additional executive session be scheduled. The presiding director of these executive sessions is the Independent ChairmanChair of the Board, Mr. Lowenthal.Board.
Board Leadership Structure; Separate Independent ChairmanChair of the Board
Since the 2004 IPO, the roles of Chief Executive Officer and ChairmanChair of the Board have been separate. Currently, Mr. LowenthalMs. Donnell serves as the ChairmanChair of the Board andBoard. Mr. Bayless serves as a director and Chief Executive Officer. The Board of Directors believes this is the most appropriate structure for us at this time because it makes the best use of Mr. Lowenthal’sthe Chair's skills and experience gained over a distinguished career, including as a founder and President of Wellsford Real Properties, Inc.career.
Board’s and Committees’ Roles Inin Risk Oversight
The Board, as a whole, has responsibility for risk oversight, with reviews of certain areas being conducted by the relevant committees that report on their deliberations to the Board. The oversight responsibility of the Board and its committees is enabled by management's reporting processes that are designed to provide visibility to the Board about the identification, assessment and management of critical risks and management’s risk mitigation strategies. These areas of focus include competitive, economic, operational (including those related to cybersecurity), financial (accounting, credit, liquidity and tax), legal, regulatory, compliance, health, safety and environment, and reputational risks. The Board and its committees oversee risks associated with their respective principal areas of focus, as summarized in the following Board Committee table. Each committee meets in executive session with key management personnel and representatives of outside advisors (for example, the head of Internal Audit meets in executive session with the Audit Committee).
Oversight of Cybersecurity Risk
The Board and waste diversion data at the property-level. Additional information regardingStrategic Planning and Risk Committee oversee the Company’s ESG initiatives may be found online at www.AmericanCampus.com at About Us (although nonemanagement of cybersecurity risk. While the Company has not experienced a material cybersecurity breach, to mitigate the risks posed by cybersecurity incidents and cyber-attacks, we have developed processes and procedures, including incident response plans, which are designed to protect the
20
confidentiality, integrity and continued availability of the informationCompany’s data and systems, and are working toward alignment with the National Institute of Standards and Technology (NIST) 800-53, Cyber Security Framework in key areas. To assist in our efforts, the Company partners with a third-party managed infrastructure & security services provider that operates a dedicated security operations center. Additionally, the Company maintains a cybersecurity risk insurance policy, performs simulations, tabletop exercises and tests for preparedness, conducts annual education, training and ongoing assessment of our employees and those with systems access, performs periodic third-party security assessments on our critical systems and collaborates with peers and industry professionals to stay abreast of cybersecurity matters. Our Chief Technology Officer, who holds a CERT Certificate in Cybersecurity Oversight, provides quarterly updates to the Company’s website is incorporated into this Proxy Statement by reference).Strategic Planning and Risk Committee, which regularly briefs the full Board on these matters.
Board Committees
The following table identifies each committee of the Board, its key function, its primary areas of risk oversight and the number of meetings held during 2019.2021. A copy of the charter for each of these committees (other than the Executive Committee) is available on the Company’s website at www.AmericanCampus.com.
www.AmericanCampus.com.
| COMMITTEE | KEY RESPONSIBILITIES | |||||||||||||
| Board of Directors | Strategic oversight | |||||||||||||
| Corporate governance | ||||||||||||||
| Primary areas of oversight: | ||||||||||||||
▪ Strategic, financial and execution risks and exposures associated with annual operating and | ||||||||||||||
▪Ongoing CEO and key management succession planning processes, including establishing selection criteria that reflect our business strategies, identifying and evaluating potential internal candidates and making key management succession decisions | ||||||||||||||
▪Company culture and enterprise workforce management matters including structure, compensation and diversity, equity and inclusion | ||||||||||||||
▪Other current matters that may present material risk to the Company's operations, plans, prospects or | ||||||||||||||
| Audit | Overseeing the integrity of the Company's consolidated financial statements and its compliance with legal and regulatory requirements | 8 | ||||||||||||||
| Audit Committee Report: | Assessing the independent auditor's qualifications, independence, and | |||||||||||||||
Page | performance | |||||||||||||||
| Charter last amended October 2013 | Reviewing, as it deems appropriate, the adequacy of the Company's systems of disclosure controls and internal controls regarding financial reporting and accounting | |||||||||||||||
| Sole authority to appoint and replace the independent auditors (who report directly to the committee), approve the engagement fee of the independent auditors, and pre-approve the audit services and any permitted non-audit services that the independent auditors may provide to the Company | ||||||||||||||||
| Primary areas of oversight: | ||||||||||||||||
▪ Risks and exposures associated with financial matters, particularly financial reporting, tax, accounting, disclosure, internal control over financial reporting, financial policies, investment guidelines and credit and liquidity matters | ||||||||||||||||
21
| COMMITTEE | KEY RESPONSIBILITIES | 2021 MEETINGS | ||||||||||||
| Capital Allocation | Advising the full Board regarding the evaluation of capital allocation strategy and priorities to further improve investment strategies, net asset value creation and the quality of earnings growth | 8 | ||||||||||||
| Charter established January 2021 | ||||||||||||||
| Primary areas of oversight: | ||||||||||||||
▪Capital allocation priorities, including but not limited to development activities and acquisitions, and dividend and capital return policy | ||||||||||||||
▪Short-term and long-term balance sheet optimization plans | ||||||||||||||
| Compensation | Establishing the Company's general compensation philosophy | |||||||||||||
| Compensation Committee Report: | Overseeing the Company's compensation programs and practices including any employment, severance and termination agreements, or arrangements with any Named Executive Officer | |||||||||||||
Page | ||||||||||||||
Charter last amended June 2013 | Reviewing and approving corporate goals and objectives relevant to the compensation of Named Executive Officers | |||||||||||||
| Evaluating annually the performance of the Named Executive Officers in light of the goals and objectives | ||||||||||||||
| Determining the compensation level of each Named Executive Officer based on this evaluation | ||||||||||||||
| Primary areas of oversight: | ||||||||||||||
▪ Risks and exposures associated with leadership assessment and executive compensation programs and arrangements, including incentive plans | ||||||||||||||
| Executive | Approving, subject to certain limitations, acquisitions, financings, and dispositions | 0 | ||||||||||||
| Authorizing the execution, subject to certain limitations, of certain contracts and agreements, including those relating to the borrowing of money | ||||||||||||||
| Exercising generally all other powers of the Board, except for those that require action by all directors or the non-employee directors under the Company's articles of incorporation, bylaws or applicable law | ||||||||||||||
| Nominating and Corporate Governance | Assisting the Board in promoting the Company's and the | |||||||||||||||
| Charter last amended March 2010 | Identifying individuals qualified to become Board members, consistent with criteria approved by the Board and recommending to the Board the director nominees for the next Annual Meeting | |||||||||||||||
| Developing and recommending to the Board a set of corporate governance principles applicable to the Company | ||||||||||||||||
| Overseeing the evaluation of the Board and management | ||||||||||||||||
| Conducting annual succession planning for the CEO and other executive officers | ||||||||||||||||
| Primary areas of oversight: | ||||||||||||||||
22
| COMMITTEE | KEY RESPONSIBILITIES | 2021 MEETINGS | ||||||||||||
| Strategic Planning and Risk | Assessing the Company's risk profile and crisis management strategy relating to key risks | |||||||||||||
| Charter last amended August 2015 | ||||||||||||||
| Approving plans for detecting, responding to and mitigating security breaches | ||||||||||||||
| Primary areas of oversight: | ||||||||||||||
▪ | ||||||||||||||
▪ Evaluating the Company's | ||||||||||||||
▪ Plans for detecting, responding to and mitigating | ||||||||||||||
▪ Crisis management policies and procedures | ||||||||||||||
▪ Risks associated with | ||||||||||||||
(1)All directors attended at least 75% of the total number of meetings of the Board and committees, collectively, on which they served during 2019.2021. All directors are encouraged to attend the Annual Meeting. All the persons then serving as members of the Board attended the 20192021 Annual Meeting.
23
Committee Charting
The following table graphically displays the current directors, the current committee members, the respective committee chair, the independent members and Audit Committee financial expertsFinancial Experts (as such term is defined in Item 407(d)(5)(ii) of Regulation S-K), based on their expertise in accounting and financial management. Each member of the Nominating and Corporate Governance, Compensation, Audit, Capital Allocation and Strategic Planning and Risk Committees satisfies the independence requirements of applicable law and the applicable requirements of the SEC and NYSE.
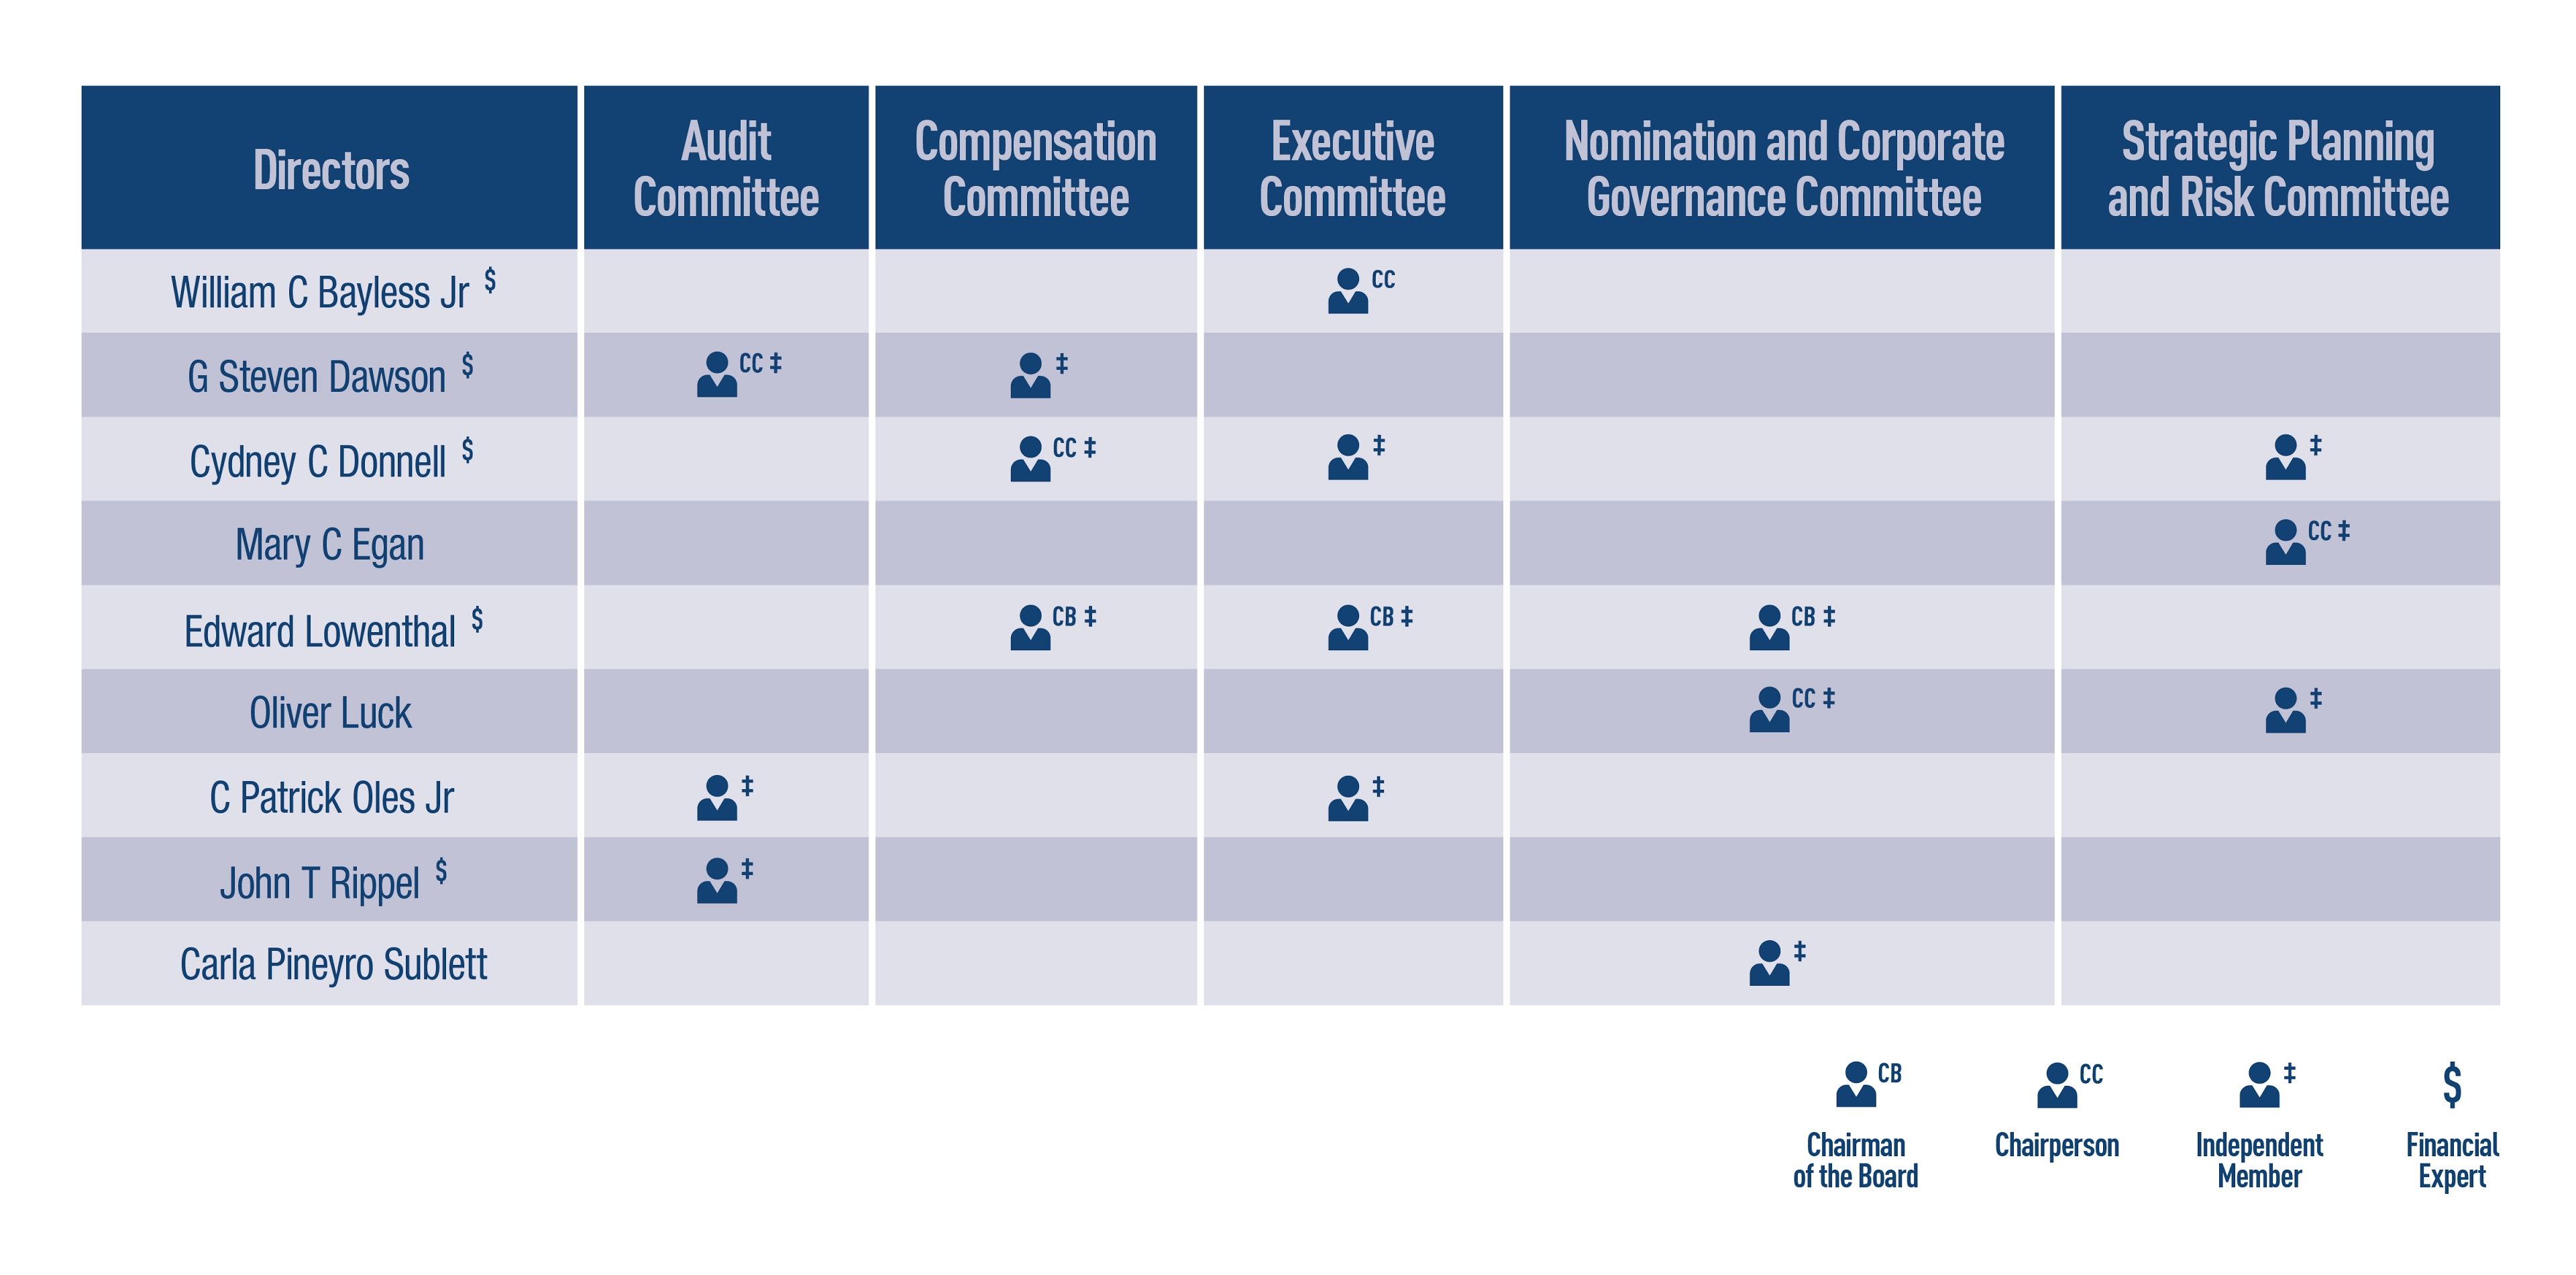
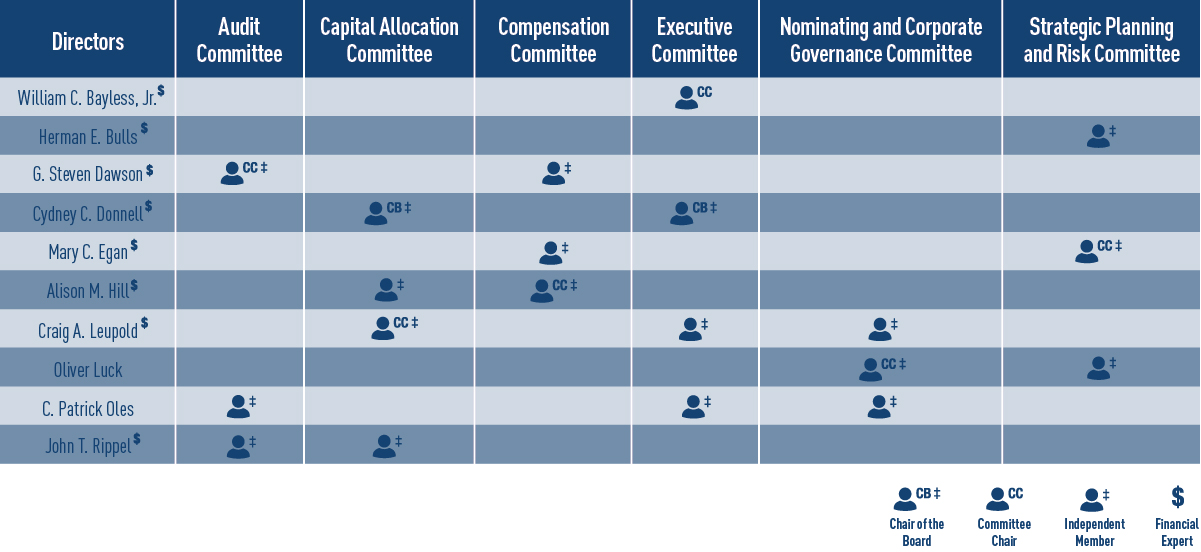
24
Board and Committee Evaluations
The Board recognizes that a thorough, constructive evaluation process enhances the effectiveness of the Board and contributes to the implementation of the Company’s governance practice. It is important to take stock of Board, committee, and director performance and to solicit and act upon feedback received. As such, each director participates in the annual process outlined below.
| 1 | Corporate Governance Review Our Board Chair and the Chair of our Nomination and Corporate Governance Committee examine our evaluation process to ensure that the processes allows directors the opportunity to provide actionable feedback on the functioning of the Board as a whole as well as the performance of committees. | ||||
| 2 | Annual Board and Committee Evaluations Each Board member participates in an individual interview administered by a third-party to provide feedback regarding individual Board members and the Board and committees. | ||||
| 3 | Review of Evaluations The Nominating and Corporate Governance Committee reviews a summary of the individual interviews and discusses the feedback with the third-party interviewer. The Nominating and Corporate Governance Committee will also review the individual directors as circumstances warrant. | ||||
| 4 | Feedback Incorporated Policies and practices appropriately updated as a result of director feedback. | ||||
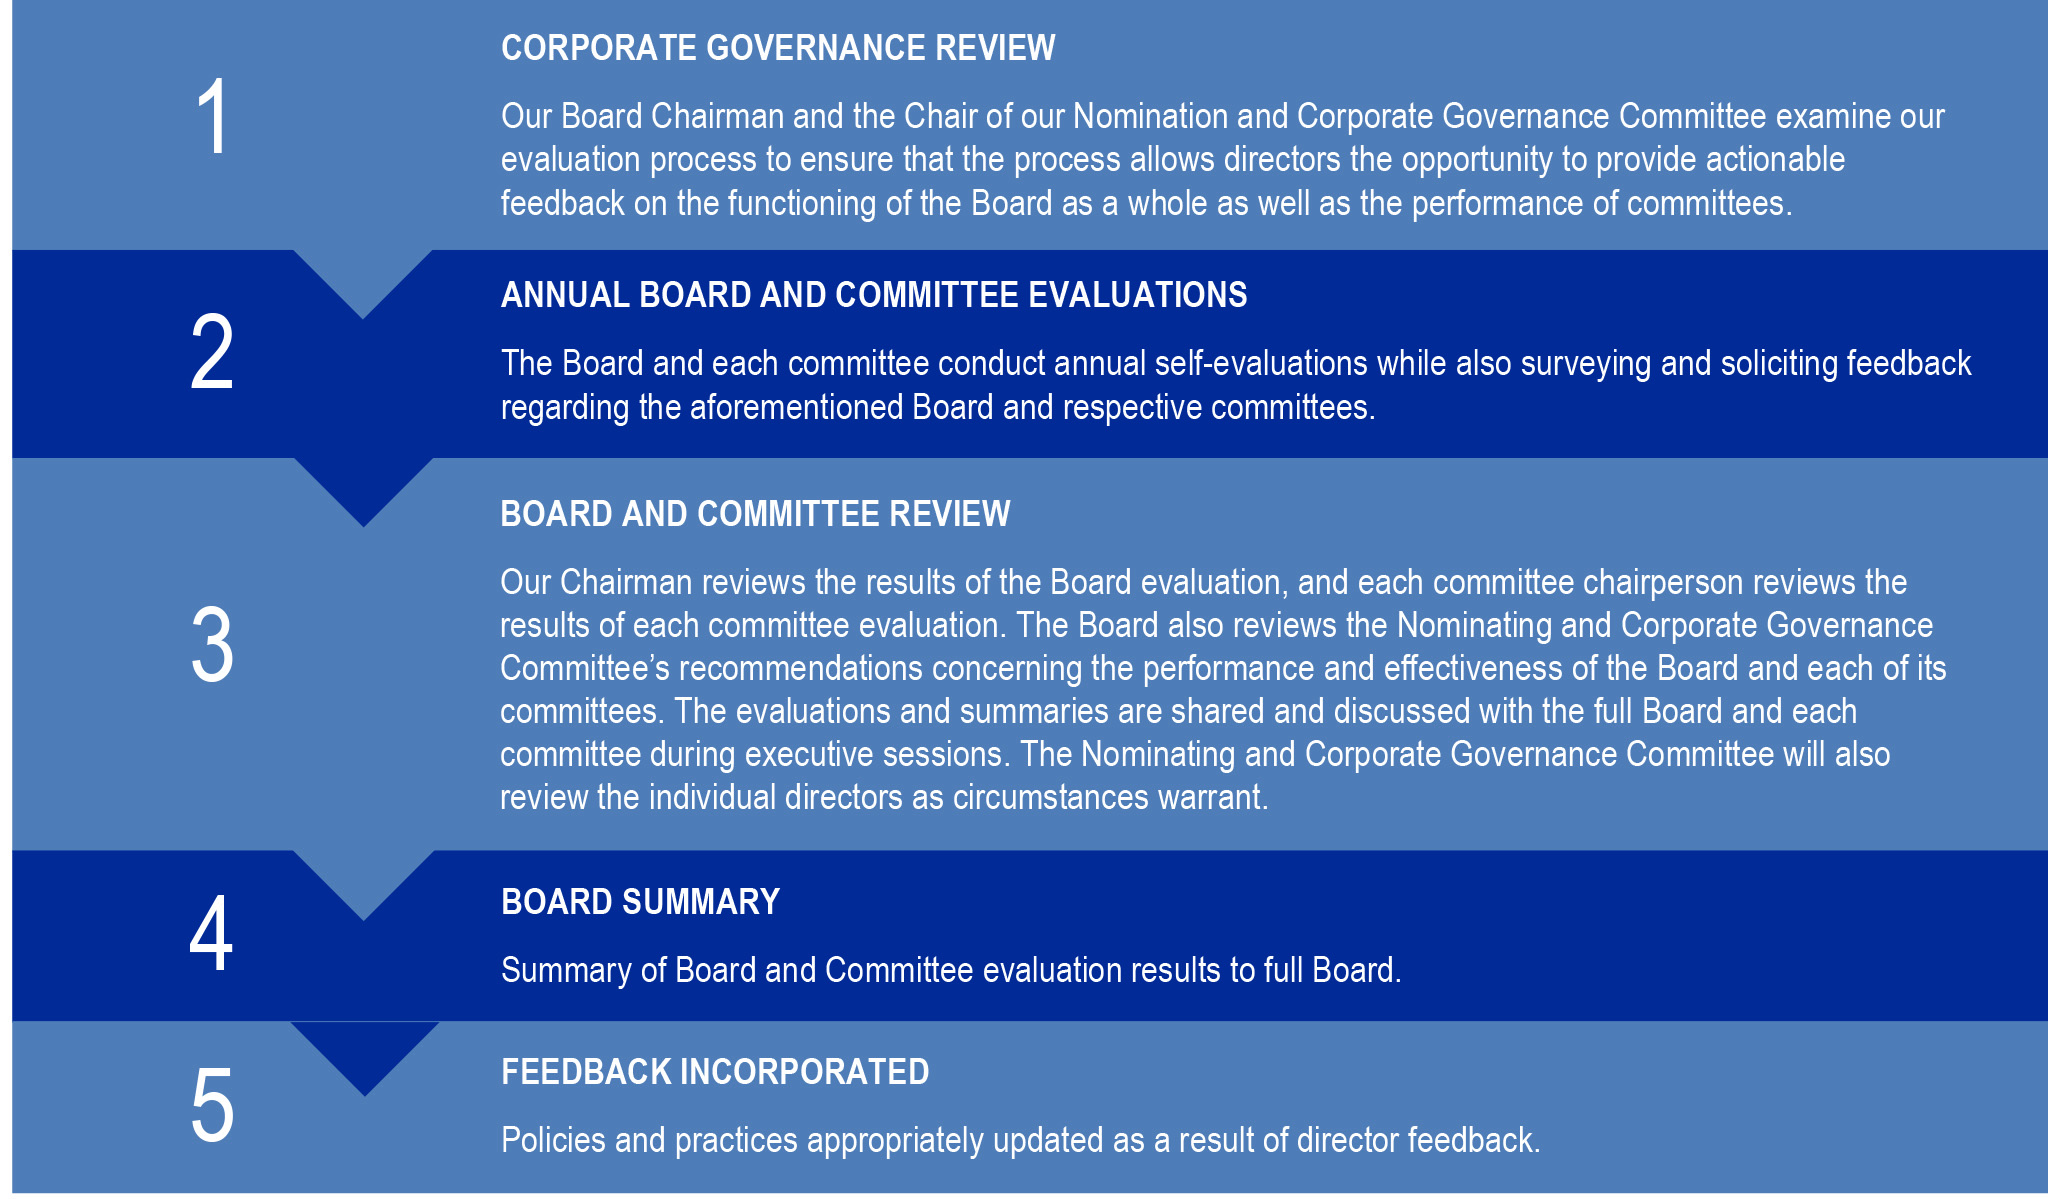
BOARD AND COMMITTEE EVALUATIONS INCLUDE, BUT ARE NOT LIMITED TO: | |||||||||||
| Director Performance | Board and Committee Operations | Board Performance | Committee Performance | ||||||||
| Chair of the Board (in that role) Each Committee Chair (in that role) Evolving director skills and expertise Periodic individual director performance | Board and Committee membership: refer to Director Qualifications Fine-tuning committee structure to enhance Board and committee performance Conduct of meetings Quality and quantity of materials and information received from management and access to senior staff | Strategic areas of focus for the Board Consideration of shareholder value Strategic oversight Capital planning Capital allocation Risk management Shareholder feedback | Performance of committee duties under committee charters Considerations of reputation Effectiveness of outside advisors Identification of strategic topics that warrant additional attention and discussion | ||||||||
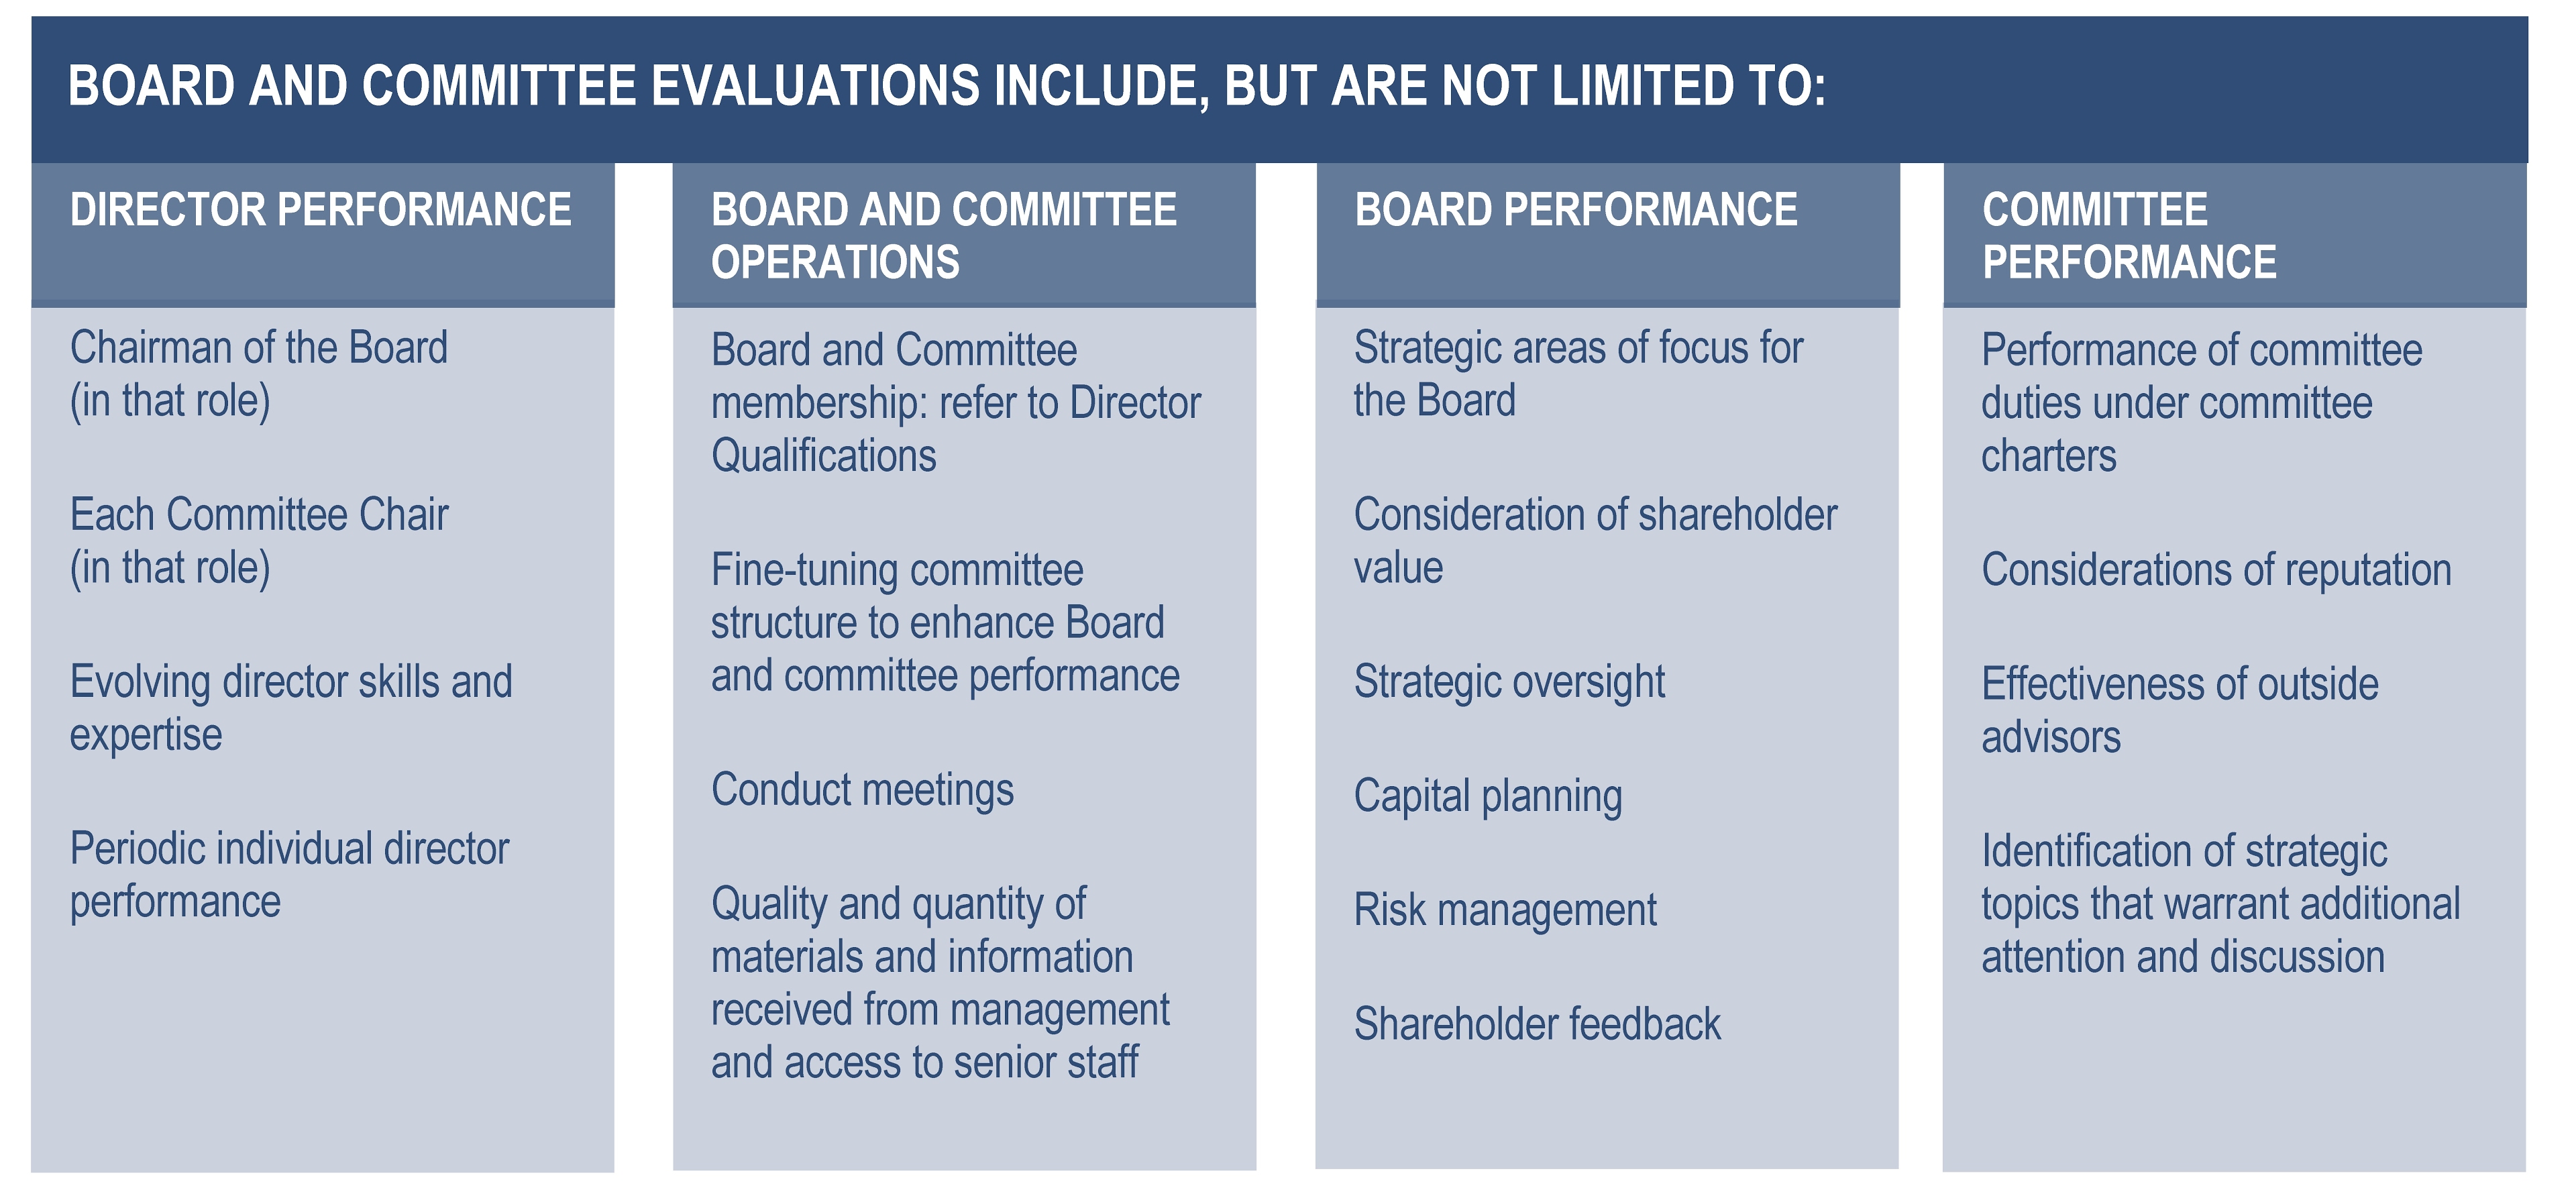
25
Director Qualifications; Limits on Board Service
The Nominating and Corporate Governance Committee reviews with the Board on an annual basis the appropriate skills and characteristics required of Board members in the context of the then-current composition of the Board. In addition to qualities of intellect, this assessment includes integrity and judgment, business experience and knowledge, reputation and character, issues of diversity, (as discussed below), relevant industry and trade association and university knowledge and participation, accounting and financial expertise, public company experience, leadership experience, and relevant legal and regulatory qualifications. The committee also seeks candidates who are willing to challenge management in a productive and constructive manner, and who possess the willingness and ability to devote the time and effort required to effectively serve on the Board. The committee makes this determination in the context of an assessment of the perceived needs of the Board at that point in time. The committee evaluates all nominees for director based on these criteria, including nominees that may be recommended by stockholders.shareholders. This process resulted in the appointment of three new directors in January 2021 as described under “Board Composition and Refreshment.”
The Board recognizes that its members benefit from service on the boards of other companies. That service is encouraged, but it is also critical that directors have the opportunity to dedicate sufficient time to their service on our Board. To that end, the Board evaluates individuals who serve on more than six other public company boards will not normally be asked to join the Board unless the Board determines that such simultaneous service wouldensure those additional responsibilities will not impair the ability of such individual to effectively serve on the Board.
Term Limits; Retirement Age
The Guidelines on Governance provide that, as a general matter, non-employee directors will not stand for election to a new term of service at any Annual Meeting following their 75th birthday. However,75th birthday, subject to the approval of the Board may approve exceptionsto an exception to this practice when it believes it is in the Company’s interest to do so. The Board has approved such exception with respect to Mr. Lowenthal.practice. The Board does not believe it should establish term limits for director service, instead preferring to rely upon the mandatory retirement age and the evaluation procedures described below as primary methods of ensuring that each director continues to act in a manner consistent with the best interests of the Company, stockholdersshareholders and the Board. The Board believes that term limits have the disadvantage of limiting valuable insights from directors who have been able to develop, over a period of time, a specialized understanding of student housing and, therefore, provide a beneficial contribution to the Board as a whole.whole, in addition to valuable insights serving interests outside the Company.
Board Diversity
The Nominating and Corporate Governance Committee considers the current composition of the Board in light of the diverse communities and geographies the Company serves and the interplay of a candidate’s or nominee’s experience, education, skills, background, gender, race, age, ethnicity, and other qualities and attributes with those of the other Board members. Consideration extends beyond the traditional notion of diversity to include a more broadbroader range of experience, thought, perspectives, and competencies to enable effective board leadership. In implementing its practice of considering diversity of thought, more emphasis may be placed on attracting or retaining director nominees with certain specific competencies or experience, such as industry, regulatory, operational, or financial expertise, depending on the circumstances and the composition of the Company’s Board at the time. Gender, age, race, and ethnic diversity also have been, and will continue to be, a priority in the director nomination process as a board comprised of directors with widely-varying backgrounds provideprovides a more robust and complex perspective and is better able to provide oversight in driving sustainable financial performance in the current complex and rapidly-evolving business environment. The Nominating and Corporate Governance Committee and independent members of the Board remain cognizant of the Board’s characteristics, monitoring the effectiveness of the current practice and focusing on its diverse priorities as the Board evolves and new candidates or nominees are considered. In 2019,Through the Board'sBoard’s refreshment efforts, diversity was enhanced with the appointment of Carla Piñeyro Sublett, a proven leader with a wealth of global sales and marketing experience who expanded the Board's existing gender, ethnicrace, ethnicity and age diversity, whilehave been significantly enhanced, providing additional diversity of thought and expertise to the Board.
26
Number of Directors; Director Vacancies
The bylaws provide that at any regular meeting or at any special meeting called for that purpose, a majority of the entire Board of Directors may increase or decrease the number of directors, provided that there cannot be less than three directors. The tenure of office of a director will not be affected by any decrease in the number of directors. The bylaws also provide that if any or all the directors cease to be directors, any vacancy, other than vacancies that result from an increase in the number of directors or from the removal of a director, may in general be filled solely by a majority of the remaining directors, even if the remaining directors do not constitute a quorum. Any vacancy that results from an increase in the number of directors constituting the entire Board of Directors may be filled by a majority of the entire Board of Directors. Any vacancy that results from the removal of a director may be filled either by a majority of the remaining directors or the Company’s stockholders.shareholders. Any director elected to fill a vacancy will hold office until the next annual election of directors and until a successor is elected and qualified.
Shareholder Approval of Amendment of the Charter and Bylaws and Transactions Outside the Ordinary Course of Business
The Company’s charter, including its provisions on removal of directors, may be amended by the affirmative vote of the holders of at least a majority of all of the votes entitled to be cast on the matter. The Company’s bylaws may be amended by a majority of the directors or by the affirmative vote of at least a majority of all of the votes entitled to be cast on the matter.
The charter provides that the Company may not merge with or into another entity, sell all or substantially all of its assets, engage in a share exchange or engage in similar transactions outside the ordinary course of the Company’s business unless the transaction or transactions are approved by the affirmative vote of the majority of all of the votes entitled to be cast on the matter, except if:
•the merger will merge one of the Company’s 90% or more owned subsidiaries into the Company without amending the charter other than in limited respects and without altering the contract rights of the stock of the subsidiary (in which case only the approval of the Board of Directors and the board of directors of the subsidiary is necessary);
•the Company is the successor corporation in a share exchange (in which case only the approval of the Board of Directors is necessary); or
•the Company is the survivor in the merger and the merger does not change the terms of any class or series of the Company’s outstanding stock, or otherwise amend the charter, and the number of shares of stock of each class or series outstanding immediately before the merger does not increase by more than 20% of the number of shares of each such class or series of stock that was outstanding immediately prior to effectiveness of the merger (in which case only the approval of the Board of Directors is necessary).
27
Guidelines on Governance and Codes of Ethics
The Board has adopted Guidelines on Governance to address significant corporate governance issues. These guidelines provide a framework for the Company’s corporate governance initiatives and cover a variety of topics, including the role of the Board, Board selection and composition, Board committees, Board operation and structure, Board orientation and evaluation, Board planning and oversight functions and stock ownership guidelines. The Nominating and Corporate Governance Committee is responsible for overseeing and reviewing the guidelines and reporting and recommending to the Board any changes to the guidelines.
The Board of Directors has also adopted a Code of Business Conduct and Ethics, which is designed to help officers, managers and employees resolve ethical issues in an increasingly complex business environment. It covers topics such as reporting unethical or illegal behavior, compliance with law, share trading, conflicts of interest, fair dealing, protection of the Company’s assets, disclosure of proprietary information, internal controls, personal community activities, business records, communication with external audiences and obtaining assistance to help resolve ethical
issues. The Board also adopted a Code of Ethical Conduct for Senior Financial Officers, which is applicable to the Company’s principal executive officer, principal financial officer, principal accounting officer or controller and persons performing similar functions.
You may obtain a copy of the committee charters, Guidelines on Governance, Code of Business Conduct and Ethics and Code of Ethical Conduct for Senior Financial Officers at www.AmericanCampus.com.
Management Succession
Pursuant to the Company’s Guidelines on Governance, the Board undertakes regular and appropriate succession planning for the Chief Executive Officer and other executive officers, including policies and principles for selection and performance review for the Chief Executive Officer, as well as policies regarding succession in case of emergency or the retirement of the Chief Executive Officer. The Nominating and Corporate Governance Committee has reviewed the succession plans and reported on them to the Board.Board in 2021.
Shareholder Outreach, and Engagement
Stakeholder Engagement and transparencyCommunication
Communication with stockholdersall stakeholders, including shareholders, is helpful in gleaning useful feedbackessential to our ongoing review of corporate governance and executive compensation programs and practices. Board members, executive management and Investor Relations personnel engage with these interested parties from time to time to understand their perspectives on a wide variety of topics,corporate governance matters, including executive compensation, corporate governance compensation, stockholder communication, board composition, stockholder proposals, business performancepolicies and operations.corporate sustainability practices.
We also communicate with stockholdersour stakeholders through a number of routine forums, including quarterly earnings presentations, SEC filings, annualour Annual Report and Proxy Statement, the Annual Meeting, and investor meetings, investor conferences and web communications. Management's outreach efforts during 2019 included meetingsWe relay feedback and trends on corporate governance and sustainability developments to our Board and its standing Committees and work with stockholdersthem to enhance our practices and improve our disclosures.
•During 2021, our Independent Chair of the Board held telephonic calls with shareholders holding over 30% of our outstanding shares
•During 2021, management proactively engaged with shareholders who collectively held a majority of the outstanding common stock. Additionally in 2019, members of senior management proactively engaged both passive and active stockholders in an ongoing annual review ofstock
In addition to long-term business strategy, engagement frequently covered the Company’s corporate governance policies, board composition, executive compensation program, sustainability and other ESG initiatives, long-term business strategycapital allocation and other topics. As an example of the Company’s responsiveness to shareholder feedback, in recent years, shareholders have expressed desires for valuation transparency of the Company’s on-campus owned properties under the American Campus Equity (ACETM) structure, for the Company to fund a larger proportion of its development pipeline through “self-funding” including sales of mature properties, or through sales of interests in those properties, and to diversify income concentrated in the Company’s largest university markets. As part of the Company’s strategic capital program to utilize joint venture and private equity capital to enhance sustainable long-term shareholder value, in 2021, the Company formed a joint venture to recapitalize its eight-property Arizona State University student housing portfolio for aggregate proceeds of $551.3 million. This transaction addressed the communicated desires of a number of shareholders, while also fulfilling several strategic goals of the Company.
28
To promote engagement, our Board provides a number of ways to communicate with our stakeholders:
•Participating and asking questions in our annual meetings
•Requesting engagement meetings with appropriate directors on appropriate topics
•Use the reporting hotlines the Company maintains—from which director-appropriate information will be forwarded to the Board
•Stakeholders can communicate with any member of the Board of Directors in writing by mailing their communication to the following address:
Chair of the Board
c/o American Campus Communities, Inc.
12700 Hill Country Blvd., Suite T-200
Austin, Texas 78738
The Chair of the Board, Cydney C. Donnell, will review all correspondence addressed to the Board, or any individual Board member, for any inappropriate correspondence and correspondence more suitably directed to management. The Chair will summarize all correspondence not forwarded to the Board and make the correspondence available to the Board for its review at the Board’s request. The Chair will forward communications to the Board prior to the next regularly scheduled meeting of the Board following the receipt of the communication as appropriate.
The information received in regular stockholderstakeholder interaction and through the Company’s proactive outreach program is shared regularly with management and the Board and is considered in the processes that set the Company’s governance practices and strategic direction. Stockholder feedback is also considered in refining and tailoring the public disclosure practices of the Company.
Director Stock Ownership GuidelinesPolicy
To further supportalign the Company’s goalinterests of achieving alignment with stockholders,our directors and shareholders, our directors are strongly encouraged to purchase and holdown shares of our common stock with a market value equal to or greater than $350,000 within five years of their election to$350,000. Stock deferred under our deferred compensation plan counts toward the Board. Additionally, senior officers (which currently total 29 persons) are strongly encouraged to acquire and hold shares of the Company’s common stock having a market value equal to or greater than the following amounts within three years of becoming a senior officer:
minimum ownership requirement. Operating partnership units, options, restricted stock awards, and units subject to vesting, settlement or forfeiture, and shares held in the Company’s deferred compensation plan count towards the recommended levels. Once a director or senior officer meets the stock ownership guidelines, periodic market declines in the value of the Company’s common stock will not adversely affect any previous determination by the Board that the stock ownership guidelines had been met by the director.
Our current nominees for director or senior officer. In addition, senior officers musthave cumulatively purchased and continue to hold and may not sell, any vested restricted36,600 shares of common stock awards untilpurchased through the applicable stock ownership guideline has been met.secondary market.
Short Selling, Hedging and Pledging Prohibitions
Directors and officers may not make “short sales” of any of the Company’s equity securities. “Short sales” are defined as sales of securities that the seller does not own at the time of the sale, or, if owned, securities that will not be delivered for a period longer than 20 days after the sale. In addition, the Company’s directors and officers may not engage in transactions in derivatives of the Company’s equity securities, including hedging transactions, and may not pledge any of the Company’s equity securities.
Repricing and Cash Buyouts of Underwater Options and Stock Appreciation Right Prohibitions
The 2018 Incentive Award Plan and Corporate Governance Guidelines prohibit the repricing of options to purchase the Company’s common stock and stock appreciation rights. The exercise price for options or stock appreciation rights will not be lowered even if the current market price of the Company’s common stock is below the exercise price. The 2018 Incentive Award Plan also prohibits cash buyouts of underwater options and stock appreciation rights. To date, the Company has not issued any stock options or stock appreciation rights.
29
Prohibition on Classifying the Board
The Company’s bylaws prohibit a future election to classify the Board pursuant to Section 3-803 of the Maryland General Corporation Law, which prohibition may not be repealed unless approved by stockholdersshareholders by the affirmative vote of at least a majority of all the votes cast on the matter by stockholdersshareholders entitled to vote on the matter.
COMPENSATION OF DIRECTORS
The table below sets forth the quarterlyannual cash fees paid to non-employee directors for 2019:2021 (which are paid quarterly):
| Board Member (other than Chair of the Board) | |||||
| Annual Fee | $ | 77,500 | |||
| Chair of the Board | |||||
| Annual Fee | 103,000 | ||||
| Audit Committee | |||||
| Chair Annual Fee | 22,500 | ||||
| Capital Allocation Committee | |||||
| Chair Annual Fee | 22,500 | ||||
| Compensation Committee | |||||
| Chair Annual Fee | 22,500 | ||||
| Nominating and Corporate Governance Committee | |||||
| Chair Annual Fee | 22,500 | ||||
| Strategic Planning and Risk Committee | |||||
| Chair Annual Fee | 22,500 | ||||
| Board Member (other than Chairman of the Board) | |||
| Quarterly Fee | $ | 18,750 | |
| Chairman of the Board | |||
| Quarterly Fee | 25,000 | ||
| Audit Committee | |||
| Chair Quarterly Fee | 5,625 | ||
| Compensation Committee | |||
| Chair Quarterly Fee | 4,687 | ||
| Nominating and Corporate Governance Committee | |||
| Chair Quarterly Fee | 3,750 | ||
| Strategic Planning and Risk Committee | |||
| Chair Quarterly Fee | 3,000 | ||
Mr. Bulls, Ms. Hill and Mr. Leupold received Restricted Stock Units (RSUs) with a dollar value of $122,500 on January 27, 2021, the date on which they were appointed to the Board. On May 1, 2019,April 28, 2021, the date of the 20192021 Annual Meeting, each Director Nominee of the Boardnominee was re-elected and each non-employee director, other than the ChairmanChair of the Board, received 2,4952,724 restricted stock units, or RSUs, and the ChairmanChair of the Board received 3,4503,780 RSUs, valued at $47.11$44.98 per RSU, or a value of $117,500$122,500 and $162,500,$170,000, respectively. All 20192021 RSU grants immediately vested and were settled in shares of the Company’s common stock and/or cash in lieu of the delivery of shares. As of December 31, 2019,2021, no RSUs were outstanding.
On the date of the 20202022 Annual Meeting, each non-employee director who is re-elected to the Board of Directors, other than the ChairmanChair of the Board, will receive RSUs with a value of $122,500, and the ChairmanChair of the Board will receive RSUs with a value of $170,000$170,000.
Members of the Board of Directors are also reimbursed for travel expenses incurred in connection with the Company’s business, including attendance at meetings of the Board and its committees.
For 2020, each2022, we expect that Board member (other than the Chairman of the Board)compensation will be unchanged from that paid a quarterly cash fee of $19,375 and the Chairman of the Board will be paid a quarterly cash fee of $25,750. In additionin 2021.
30
The table below summarizes the compensation paid to each non-employee director for 2019:2021:
Name (1) | Fees Earned or Paid in Cash | Stock Awards (2) | Change in Pension Value and Nonqualified Deferred Compensation Earnings (3) | Total | ||||||||||||||||||||||
Herman E. Bulls(4) | $ | 71,903 | $ | 245,000 | — | $ | 316,903 | |||||||||||||||||||
| G. Steven Dawson | 100,000 | 122,500 | — | 222,500 | ||||||||||||||||||||||
| Cydney C. Donnell | 102,019 | 170,000 | — | 272,019 | ||||||||||||||||||||||
| Mary C. Egan | 100,000 | 122,500 | — | 222,500 | ||||||||||||||||||||||
Alison M. Hill(4) | 87,109 | 245,000 | — | 332,109 | ||||||||||||||||||||||
Craig A. Leupold(4) | 92,778 | 245,000 | — | 337,778 | ||||||||||||||||||||||
Edward Lowenthal(5) | 51,500 | — | — | 51,500 | ||||||||||||||||||||||
| Oliver Luck | 100,000 | 122,500 | — | 222,500 | ||||||||||||||||||||||
| C. Patrick Oles, Jr. | 77,500 | 122,500 | — | 200,000 | ||||||||||||||||||||||
| John T. Rippel | 77,500 | 122,500 | — | 200,000 | ||||||||||||||||||||||
(1)William C. Bayless, Jr., Chief Executive Officer, is not included in this table as he is an employee and thus receives no compensation for his service as director. The compensation received by Mr. Bayless as an employee is shown in the Summary Compensation Table.
(2)Represents aggregate grant date fair value of awards at date of grant. Assumptions used in the calculation of these amounts are included in note 11 to the Company’s audited financial statements for the year ended December 31, 2021 included in the annual report on Form 10-K for the year ended December 31, 2021. Certain shares have been deferred by the director pursuant to the deferred compensation plan as shown on the Security Ownership Table.
(3)The Company does not have a pension plan. There were no earnings on nonqualified deferred compensation for directors that were above-market or preferential.
(4)Mr. Bulls, Ms. Hill and Mr. Leupold received RSUs with a dollar value of $122,500 on January 27, 2021, the date on which they were appointed to the Board.
(5)Mr. Lowenthal resigned as Chair of the Board in May 2021.
OUR COMPANY
We at American Campus Communities are a company of approximately 3,000 team members who enable us to provide specialized, affordable, environmentally responsible housing for students at over 200 communities. Our business continues to enjoy a favorable fundamental environment with strong public policy and financial drivers, which are combined with our Company's strategic and operational expertise. We have summarized above how our corporate responsibility practices drive value and make the world a better place. We summarize here the backgrounds of some of our team members who make this possible.
31
Name (1) | Fees Earned or Paid in Cash | Stock Awards (2) | Change in Pension Value and Nonqualified Deferred Compensation Earnings (3) | Total | |||||||||||
| G. Steven Dawson | $ | 97,500 | $ | 117,500 | — | $ | 215,000 | ||||||||
| Cydney C. Donnell | 93,750 | 117,500 | — | 211,250 | |||||||||||
| Mary C. Egan | 86,000 | 117,500 | — | 203,500 | |||||||||||
| Edward Lowenthal | 100,000 | 162,500 | — | 262,500 | |||||||||||
| Oliver Luck | 90,000 | 117,500 | — | 207,500 | |||||||||||
| C. Patrick Oles, Jr. | 75,000 | 117,500 | — | 192,500 | |||||||||||
| John T. Rippel | 75,000 | 117,500 | — | 192,500 | |||||||||||
| Carla Piñeyro Sublett | 54,396 | 117,500 | — | 171,896 | |||||||||||
Executive Officers
The Company’s executive officers are elected by the Board to serve at the pleasure of the Board or until their successors are elected and qualified. The following executive officers are not directors. For information regarding William C. Bayless, Jr., Chief Executive Officer, see “Board of Directors – Board Composition.”
 | Experience •Executive Vice President and Chief Operating Officer •Executive Vice President •Senior Vice President •Vice President | |||||||||||||
Previous Experience •JPI - Property Management, various | ||||||||||||||
Education •B.A. | ||||||||||||||
Jennifer Beese Age: 48 | ||||||||||||||
 | Experience •Senior Vice President and Chief Technology •Senior Vice President •Vice President | |||||||||||||
Previous Experience •Visa - Director of Product Management •Lockheed Engineering and •Everest Technologies, Inc.- Co-founder and principal consultant | ||||||||||||||
Jorge de Cárdenas EVP & CTO Age: 58 | ||||||||||||||
Education •B.S. Computer Science, specializations Mathematics, Management, Texas A&M University | ||||||||||||||
32
  | Experience •Senior Vice President •Leasing Consultant, Director of | |||||||||||||
Previous Experience •JPI | ||||||||||||||
Lonnie M. Ledbetter Age: 50 | ||||||||||||||
 | Experience •Executive Vice •Senior Vice •Vice President | |||||||||||||
Previous Experience •Citigroup Global Markets •BNP Paribas and | ||||||||||||||
Daniel B. Perry EVP & CFO Age: 48 | Education •B.A. Finance and Accounting, Texas A&M University •M.B.A. NYU Stern School of Business | |||||||||||||
 | Experience •Executive Vice •Senior Vice •Director of Acquisitions, | |||||||||||||
Previous Experience •Lend Lease Real Estate | ||||||||||||||
William W. Talbot EVP & CIO Age: 47 | Education •B.A. Economics and Spanish, Vanderbilt University | |||||||||||||
33
 | Experience •Executive Vice President and Controller •Senior Vice President and Controller •Vice President and | |||||||||||||
Previous Experience •AMB Property Corporation (now Prologis) – Assistant Controller •Arthur Andersen LLP | ||||||||||||||
Education •Certified Public Accountant •B.B.A. and | ||||||||||||||
Kim K. Voss EVP & CAO Age: 46 | ||||||||||||||
 | Experience •Senior Vice President – Public-Private | |||||||||||||
Previous Experience •RBC Capital •Banc One Capital Markets | ||||||||||||||
James E. Wilhelm III EVP Public-Private Transactions Age: 58 | Education •B.S. Finance, Miami University | |||||||||||||
 | Experience •Executive Vice President, General Counsel (since 2020) •Various positions – (2000 – 2020) | |||||||||||||
Previous Experience •Aspen Gold Development Company – private real estate developer •Oklahoma Christian University – General Counsel | ||||||||||||||
Education •B.S. History-Pre-law, Oklahoma Christian University •J.D. Oklahoma City University | ||||||||||||||
Brian Winger EVP General Counsel Age: 54 | ||||||||||||||
34
SECURITY OWNERSHIP
The following table sets forth the number of all shares of common stock beneficially owned by each director, by each named executive officer, by each person known to beneficially own 5% or more of the Company’s outstanding common stock, and by all directors and executive officers as a group on March 9, 2020,1, 2022 unless otherwise indicated in the footnotes. Each of the following persons and members of the group had sole voting power and sole dispositive power with respect to the shares shown unless otherwise indicated in the footnotes. Unless otherwise indicated, the address of each named person is c/o American Campus Communities, Inc., 12700 Hill Country Blvd., Suite T-200, Austin, Texas 78738.
| Name of Beneficial Owner | Amount and Nature of Beneficial Ownership Number of Shares Beneficially Owned | Percent of Class | |||||||||||||||
| The Vanguard Group | 20,093,052 | (1) | 14.3% | ||||||||||||||
| BlackRock, Inc. | 16,179,048 | (2) | 11.5% | ||||||||||||||
| T. Rowe Price Associates, Inc. | 7,277,366 | (3) | 5.2% | ||||||||||||||
| William C. Bayless, Jr. | 459,065 | (4) | * | ||||||||||||||
| William W. Talbot | 187,959 | (5) | * | ||||||||||||||
| Daniel B. Perry | 151,666 | (6) | * | ||||||||||||||
| Jennifer Beese | 129,734 | (7) | * | ||||||||||||||
| Kim K. Voss | 63,083 | (8) | * | ||||||||||||||
| John T. Rippel | 51,390 | (9) | * | ||||||||||||||
| G. Steven Dawson | 29,101 | (10) | * | ||||||||||||||
| Cydney C. Donnell | 28,851 | * | |||||||||||||||
| C. Patrick Oles, Jr. | 14,087 | (11) | * | ||||||||||||||
| Mary C. Egan | 11,558 | (12) | * | ||||||||||||||
| Oliver Luck | 10,964 | (13) | * | ||||||||||||||
| Herman E. Bulls | 5,742 | * | |||||||||||||||
| Alison M. Hill | 5,742 | (14) | * | ||||||||||||||
| Craig A. Leupold | 5,742 | (14) | * | ||||||||||||||
| All directors and executive officers as a group (18 persons) | 1,316,622 | * | |||||||||||||||
| Name of Beneficial Owner | Amount and Nature of Beneficial Ownership Number of Shares Beneficially Owned | Percent of Class | ||||
| The Vanguard Group | 20,288,928 | (1) | 14.6% | |||
| BlackRock, Inc. | 16,374,216 | (2) | 11.8% | |||
| T. Rowe Price Associates, Inc | 7,535,460 | (3) | 5.4% | |||
| William C. Bayless, Jr. | 484,941 | (4) | * | |||
| William W. Talbot | 139,358 | (5) | * | |||
| James C. Hopke, Jr. | 113,256 | (6) | * | |||
| Daniel B. Perry | 107,589 | (7) | * | |||
| Jennifer Beese | 89,489 | (8) | * | |||
| Edward Lowenthal | 37,316 | (9) | * | |||
| John T. Rippel | 33,456 | * | ||||
| G. Steven Dawson | 22,784 | (10) | * | |||
| Cydney C. Donnell | 21,478 | * | ||||
| C. Patrick Oles, Jr. | 11,375 | (11) | * | |||
| Mary C. Egan | 5,241 | * | ||||
| Oliver Luck | 4,647 | * | ||||
| Carla Piñeyro Sublett | 2,393 | (12) | * | |||
| All directors and executive officers as a group (16 persons) | 1,213,035 | * | ||||
(1)This information is based upon information contained in filings made by the shareholder with the SEC reporting beneficial ownership as of December 31, 2021. The address of The Vanguard Group is 100 Vanguard Blvd., Malvern, Pennsylvania 19355. The Vanguard Group possessed shared voting power over 202,282 shares, sole dispositive power over 19,767,891 shares and shared dispositive power over 325,161 shares.
(2)This information is based upon information contained in filings made by the shareholder with the SEC reporting beneficial ownership as of December 31, 2021. The address of BlackRock, Inc. is 55 East 52nd Street, New York, NY 10055. BlackRock, Inc. possessed sole voting power over 15,041,942 shares and sole dispositive power over 16,179,048 shares. (3)This information is based upon information contained in filings made by the shareholder with the SEC reporting beneficial ownership as of December 31, 2021. The address of T. Rowe Price Associates, Inc. is 100 E. Pratt Street, Baltimore, MD 21202. T. Rowe Price Associates, Inc. possessed sole voting power over 2,496,783 shares and sole dispositive power over 7,277,366 shares. (4)Includes 253,235 unvested restricted stock awards (“RSAs”) and 52,500 common units of limited partnership interest in the Company’s Operating Partnership (“Common Units”). Such Common Units are immediately redeemable for cash or, at the Company‘s election, an equal number of shares of the Company’s common stock. (5)Includes 97,384 unvested RSAs and 1,016 shares for which Mr. Talbot may be deemed to be the beneficial owner although he disclaims beneficial ownership of such shares and 3,800 Common Units. Such Common Units are immediately redeemable for cash or, at the Company’s election, an equal number of shares of the Company’s common stock. (6)Includes 83,668 unvested RSAs. (7)Includes 96,822 unvested RSAs. |
35
(8)Includes 31,567 unvested RSAs and 2,669 shares held in the Company’s deferred compensation plan with respect to which the trustee has voting rights.
(9)Includes 36,600 shares for which Mr. Rippel may be deemed to be the beneficial owner although he disclaims beneficial ownership of such shares.
(10)Includes 7,000 shares for which Mr. Dawson may be deemed to be the beneficial owner although he disclaims beneficial ownership of such shares. Also includes 19,101 shares held in the Company’s deferred compensation plan with respect to which the trustee has voting rights.
(11)Includes 7,156 shares held in the Company’s deferred compensation plan with respect to which the trustee has voting rights.
(12)Includes 2,724 shares held in the Company’s deferred compensation plan with respect to which the trustee has voting rights.
(13)Includes 3,593 shares held in the Company’s deferred compensation plan with respect to which the trustee has voting rights.
(14)Represents shares held in the Company’s deferred compensation plan with respect to which the trustee has voting rights.
SECTION 16(a) BENEFICIAL OWNERSHIP REPORTING COMPLIANCE
Based solely on a review of Forms 3, 4 and 5 and amendments thereto furnished to us during or with respect to 2019,2021, the Company believes that all SEC filing requirements applicable to directors, officers and beneficial owners of more than 10% of the Company’s common stock were complied with in 2019.2021, except for the following items due to administrative oversight:
•a charitable donation of 220 shares of common stock made by William Bayless in 2019 was reported in January 2022,
•RSUs granted to three board members appointed on January 27, 2021 were not reported until February 8, 2021,
•the purchase of 200 shares of common stock by John Rippel in January 2021 was reported in January 2022, and
•10,453 shares of unvested restricted stock awards were omitted from a Form 3 filed for Brian Winger on September 4, 2020 and Form 4s filed on February 1, 2021 and March 2, 2021. These unvested restricted stock awards were filed on an amended Form 3 on September 14, 2021.
36
EXECUTIVE COMPENSATION
Compensation Committee Report
The Compensation Committee of American Campus Communities, Inc. has reviewed and discussed the Compensation Discussion and Analysis required by Item 402(b) of Regulation S-K with management. Based on such review and discussions, the Compensation Committee recommended to the Board that the Compensation Discussion and Analysis be included in this Proxy Statement.
THE COMPENSATION COMMITTEE
G. Steven Dawson
Compensation Discussion and Analysis
This Compensation Discussion and Analysis (“CD&A”) provides a detailed description of the executive compensation philosophy, objectives and programs, the compensation decisions made under those programs and the factors considered by the Compensation Committee. The CD&A focuses on the compensation of the Named Executive Officers for 2019,2021, who were:
| Name | Title | |||||||
| William C. Bayless, Jr. | Chief Executive Officer | |||||||
Jennifer Beese(1) | President, Chief Operating Officer | |||||||
| William W. Talbot | Executive Vice President, Chief Investment Officer | |||||||
| Daniel B. Perry | Executive Vice President, Chief Financial Officer | |||||||
| Kim K. Voss | Executive Vice President, Chief Accounting Officer | |||||||
(1 ) Promoted to President and Chief Operating Officer effective as of August 24, 2021; served as Executive Vice President and Chief Operating Officer prior to such time.
As in previous years, Named Executive Officers for 20192021 were awarded compensation based on policies that closely link compensation to performance. These policies, in planned combination, generate rewards for achievement of high-level Company and individual performance and discourage excessive short-term risk taking. This balance is essential to align management with the long-term interests of stockholders.shareholders.
This CD&A discusses the Company, its business and individual measures used in assessing performance. These measures are discussed in the limited context of the executive compensation program. You should not interpret them as statements of the Company’s expectations or as any form of guidance. We caution you not to apply the statements or disclosures made in this CD&A in any other context.
Executive Summary
•The health and well-being of our employees, the safety of our residents, and the re-stabilization of our operations were our primary focus areas for the majority of 2021.
•Our management team, acting in concert with our eight principle objectives that were adopted early in the pandemic, took decisive action to address each of these primary focus areas.
•Despite continued disruption and uncertainty due to the COVID-19 pandemic, our business performed exceedingly well in 2021. We delivered above-median one-year and three-year total shareholder return (TSR), and significantly outperformed our goals on Net Operating Income (NOI), Funds From Operations - Modified (FFOM), and same store operating margin.
37
•Short-term incentives paid between 145% and 150% of target. Strong operational, financial, and strategic leadership, combined with financial results that exceeded plan, resulted in our CEO receiving 145% of his target opportunity and other NEOs receiving 150% of their target opportunities.
•The Company’s long-term incentive structure rewards achieved performance results and reinforces alignment with shareholder value creation. The Compensation Committee viewsgrants long-term awards at the end of a performance measurement period based on pre-determined criteria, which are further subject to five-year ratable vesting. This promotes pay-for-performance alignment and long-term retention of our executive team.
•Long-term incentives were funded between 119% and 126% of target. Weightedfinancial results were achieved at 114% of target, and strong individual performance among our leadership team resulted in final payouts of 119% of target for compensatory purposesour CEO and 126% of target for the remainder of the NEOs.
Our Company
We are one of the largest owners, managers, and developers of high-quality student housing properties in the United States in terms of beds owned and under management. ACC is a fully integrated, self-managed, and self-administered equity REIT with expertise in the acquisition, design, financing, development, construction management, leasing, and management of student housing properties. As of December 31, 2021, our total owned and third-party managed portfolio included 203 properties with approximately 140,900 beds.
We seek to own high-quality, well-designed and well-located student housing properties. We aim to acquire or develop properties in markets that have stable or increasing student populations, are in submarkets with barriers to entry and provide opportunities for economic growth as a result of their product position and/or differentiated design and close proximity to campuses, or through our superior operational capabilities. We believe that our reputation and established relationships with universities give us an advantage in sourcing acquisitions and developments and obtaining municipal approvals and community support for our development projects.
2021 Performance
In the context of the executive compensation program, the Compensation Committee assesses performance in two primary ways: (1) financial and operating performance including individual goals and objectives and results againstrelative to the Company’s growth targets, and (2) returns to stockholdersshareholders over time, both on an absolute basis and relative to other companies, including the compensation peer group (see “Compensation Consultant and Benchmarking”).
The 20192021 compensation decisions made by the Compensation Committee reflect strong continued alignment between pay and performance with respect to the pre-established measures and goals under the annual cash and long-term equity incentive plans and the performance and contributions of the Named Executive Officers to the Company’s financial and operating performance during the year. In determining the incentive compensation paid to the Named Executive Officers for 2019,2021, the Compensation Committee rigorously evaluated Companythe Company's and individual
performance relative to the pre-established measures and goals, underbut also took into consideration management’s considerable efforts and leadership in re-stabilizing the annual cashCompany's operations and long-term equity incentive plans.
| RECORD YEAR | 15 | 93% | 39% |
| Revenue, NOI, FFOM and FFOM per share | Consecutive Years of Same Store NOI Growth | Say-On-Pay Approval (5 Year Average) | Dividend Growth Since First Increase in 2012 |
It is worth acknowledging that the Company’s 2021 outlook, and therefore the financial metrics used to assess management’s performance for stockholders. In doing so,2021, were below the actual results produced for 2020. This was due to the ongoing impact of the pandemic on the 2020-2021 academic year occupancy at the Company’s properties, which affected a significant portion of 2021, and the gradual return to normal operations that was expected to occur over two academic year cycles. We are pleased to report that our team’s efforts led to significant outperformance relative to original expectations.
38
| 1 | 10.4% | 8.1% | 10.1% | ||||||||
| Returned NOI to pre-pandemic levels one year earlier than anticipated | Outperformance vs. RMS REIT Index TSR since the pandemic began | FFOM per share growth | Opening rental revenue growth generated in Fall 2021 lease-up | ||||||||
Despite COVID-19 uncertainty in early 2021, the Company accomplished significantexecuted more than 3,600 mid-term leases, improving spring occupancy levels and generating additional Net Operating Income (NOI) and Funds from Operations Modified (FFOM), which helped to further renormalize the Company’s business early in the year. Additionally, despite industry-wide preleasing for the 2021-2022 academic year pacing significantly slower than its traditional pace, the Company utilized its extensive operating knowledge and Next Gen operating systems to achieve 95.8% opening fall occupancy and 3.8% average rental rate growth for the 2022 same store portfolio as of September 30, 2021, exceeding the high end of our guidance and outperforming our student housing competitors. This outstanding performance returned same-property NOI to pre-pandemic levels in the fourth quarter, a full year earlier than we previously anticipated. To complete the year, on December 31, 2021, we formed a joint venture to recapitalize our eight-property Arizona State University student housing portfolio for aggregate proceeds of $551.3 million as part of our strategic capital program to utilize joint venture and private equity capital to enhance sustainable long-term shareholder value. The joint venture partnership is 55% owned by the Company and 45% by the minority joint venture partner, and is being completed via a two-phase closing with the first phase closed on December 31, 2021 and the second phase expected to close in the fourth quarter of 2022 or first quarter of 2023. Upon full completion, this transaction is expected to provide a total of $551.3 million of proceeds to the Company, which fully satisfies the Company’s 2022 capital sourcing needs and provides for additional capital proceeds moving into 2023.
While lingering effects of the pandemic affected our business during the year, our Company’s resilience and ability to adapt quickly were crucial to protecting the health and well-being of our employees, the safety of our residents, and re-stabilizing our operations. Strong operational, financial, and strategic objectivesleadership led to an outstanding year in which the Company exceeded the high-end of the majority of its financial and milestones, including:
A reconciliation of net income to FFO, FFOM and NOI for the year ended December 31, 2019,2021, is contained in the 20192021 Annual Report on Form 10-K and in the earnings release furnished on a Current Report on Form 8-K filed on February 19, 2020.22, 2022.
39
Compensation Policies and Practices—Good Governance
Consistent with the Company’s commitment to strong corporate governance and responsiveness to stockholders,shareholders, in 20192021 the Board maintained the following compensation policies and practices to drive performance and serve the stockholders’shareholders’ long-term interests:
ü | DO align pay and performance by linking a substantial portion of compensation to the achievement of pre-established performance measures that drive | û | DO NOT base incentive awards on a single performance measure, thereby discouraging unnecessary or excessive risk-taking | |||||||||||
ü | DO provide executive officers with the opportunity to earn market-competitive compensation through a mix of cash and equity compensation, with strong emphasis on performance-based incentive awards | û | DO NOT provide guaranteed minimum payouts or uncapped award opportunities | |||||||||||
ü | DO have a robust peer selection process and benchmark executive compensation to target the median of the comparative group of peer companies | û | DO NOT reprice or permit cash buyouts of underwater stock options | |||||||||||
ü | DO require executive officers and directors to own and retain shares of common stock that have significant value to further align interests with | û | DO NOT provide | |||||||||||
ü | DO enhance alignment with long-term shareholder value and executive officer retention with 5-year vesting schedules for equity incentive awards earned for prior-year performance | û | DO NOT provide executive officers with pension or retirement benefits other than pursuant to a 401(k) plan and a deferred compensation plan | |||||||||||
ü | DO enable the Board to “claw back” incentive compensation in the event of an accounting restatement due to material non-compliance with financial reporting requirements as a result of misconduct by executive officers | û | DO NOT permit executive officers or directors to engage in derivative or other hedging transactions in the Company’s securities | |||||||||||
ü | DO prohibit new tax gross-up arrangements under anti-tax gross-up policy | û | DO NOT provide | |||||||||||
ü | DO maintain a Compensation Committee comprised solely of independent directors | û | DO NOT provide single-trigger change of control benefits | |||||||||||
ü | DO engage an independent compensation consultant to advise the Compensation Committee on executive compensation matters and establishing an appropriate peer group | û | DO NOT permit executive officers and directors to hold the Company's securities in margin accounts or to otherwise pledge the securities to secure loans | |||||||||||
An advisory vote is submitted to stockholdersshareholders on an annual basis to approve executive compensation. Our stockholdersshareholders have consistently supported our executive compensation program. At our 2019 Annual Meeting of Stockholders, 96% of the votes cast were voted in favor of our resolution seeking advisory approval of our executive compensation. Over the last five years, stockholdershareholder support for our advisory vote on executive compensation has averaged 93%95%. While we have consistently had strong stockholder support for our executive compensation program,In addition, the Compensation Committee does useuses an independent compensation consultant to review the structure of our compensation program, and to assess the effectiveness of our program in aligning executive and stockholdershareholder interests.
While we have consistently had strong shareholder support for our executive compensation program, the Compensation Committee continues to seek feedback from shareholders on a wide variety of issues, including executive compensation, each year. In 2021, the Company, including independent directors and believes that it is well designedthe Board Chair when appropriate, engaged with investors representing a majority of the shares outstanding. Through these interactions, shareholders generally provided positive feedback on our capital allocation strategies, management and re-stabilization of our operations amidst the global pandemic, governance, executive compensation programs and ESG and corporate responsibility initiatives. In recent years, shareholders have expressed their desire for valuation transparency of the Company’s on-campus owned properties under the American Campus Equity (ACETM) structure, for the Company to achieve the objectivesfund a larger proportion of attracting, retainingits development pipeline through self-funding including sales of mature properties, or through sales of interests in those properties, and motivating talented executives and rewarding superior performanceto diversity income concentrated in the contextCompany’s largest university markets. As previously mentioned, as part of the business risk environment.our strategic capital program to utilize joint venture and private equity capital to enhance sustainable long-term shareholder value, and addressing each of these desires, in 2021, we formed a joint venture to recapitalize our eight-property Arizona State University student housing portfolio for aggregate proceeds of $551.3 million, a transaction which was consistent with general shareholder feedback received in recent years. See Shareholder Outreach, Stakeholder Engagement and Communication for additional information.
40
Objectives of the Compensation Program
The Company recognizes that effective compensation strategies are critical to recruiting, incenting and retaining key employees who contribute to long-term success and thereby create value for stockholders.shareholders. Accordingly, the compensation program is designed to achieve the following primary objectives:
•Attract, retain and motivate talented executives;
•Reward performance that meets or exceeds pre-established Company and tailored individual goals consistent with the Company’s strategic plan, while maintaining alignment with stockholders;shareholders;
•Provide balanced incentives that discourage excessive risk-taking;
•Retain sufficient flexibility to permit executive officers to manage risk and adjust appropriately to meet rapidly changing market and business conditions;
•Evaluate performance by balancing consideration of those measures management can directly influence with market forces that management cannot control (such as monetary policy and interest rate expectations), but that impact stockholdershareholder value;
•Encourage executives to become and remain long-term stockholdersshareholders of the Company; and
•Maintain compensation and corporate governance practices that support the Company’s goal to deliver sustained, superior returns to stockholders.shareholders.
Interests of the executive officers and stockholdersshareholders are aligned by maintaining a performance- and achievement-oriented environment that provides executives with the opportunity to earn market-competitive levels of cash and equity compensation for strong performance measured against key financial and strategic goals that create long-term stockholdershareholder value.
Compensation Mix
The executive compensation philosophy promotes a compensation mix that emphasizes variable pay and long-term stockholdershareholder value. An emphasis on incentive compensation creates greater alignment with the interests of stockholders,shareholders, ensures that the business strategy is executed by decision-makers in a manner that focuses on the creation of long-term value rather than only short-term results, and encourages prudent evaluation of risks. Accordingly, the compensation structure is designed such that a significant portion of Named Executive Officers’ total direct compensation is in the form of equity awards granted at the end of the performance period based on pastachieved performance that vest over time.results with additional service-based vesting requirements.
41
Pay at Risk
The following diagram illustrates the total direct compensation targets of the CEO and each other active Named Executive Officer for 2019.2021, other than Ms. Voss, for whom the Compensation Committee determined 2021 compensation based on the committee’s judgment of her overall performance and the performance of the group over which she has direct responsibility. The charts outline the size, in percentage terms, of the targeted direct compensation elements (at the date of grant) pre-established by the Compensation Committee for performance year 2019.2021. CEO target compensation reflects additional weight on long-term equity incentive compensation because the Compensation Committee believes that, due to his leadership role as Chief Executive Officer, his compensation structure should reflect even greater alignment with stockholders.shareholders. The dark outer band of the charts reflects the incentive or at-risk performance-based components of compensation (e.g.(e.g., 86% of the CEO’s 20192021 target direct compensation was at-risk performance based).
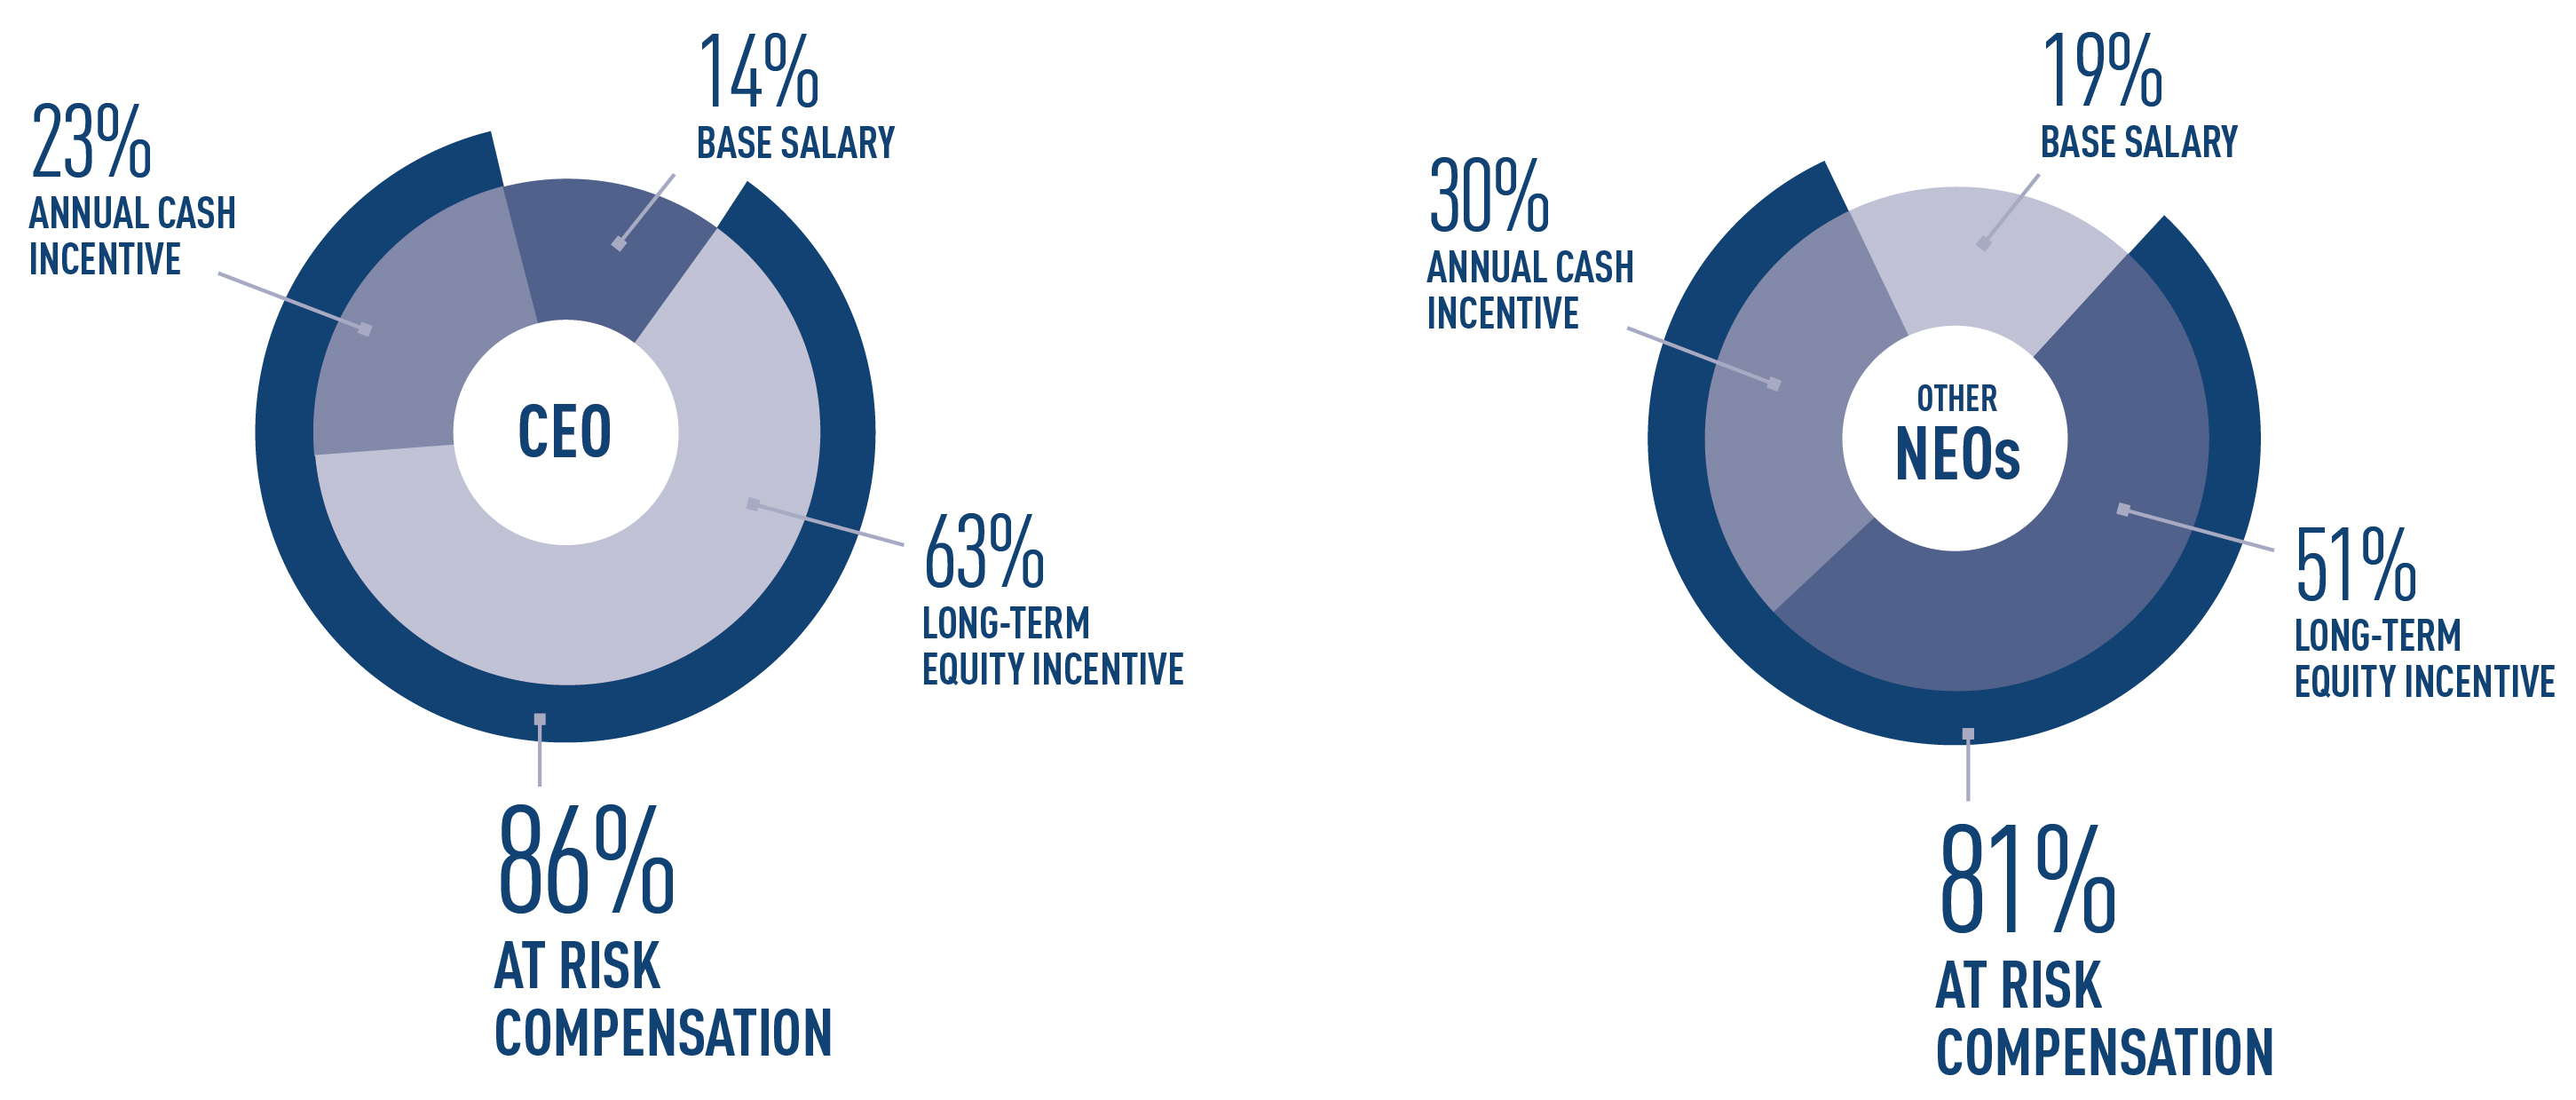
Elements and Philosophy of the Compensation Program
For 2019,2021, the compensation provided to executive officers consisted of the same elements generally available to non-executive officers: base salary; annual cash incentive compensation; long-term equity incentive compensation; and other perquisites and benefits.
| PRINCIPAL ELEMENTS OF PAY | ||||||||
| The elements of the Company’s executive compensation program are presented below in summary format. | ||||||||
| COMPONENT | FORM | PURPOSE | ||||||
| Base Salary | Cash | Provide a competitive fixed rate of pay recognizing different levels of responsibility and performance within the Company. | ||||||
| Annual Incentive | Performance Cash Award | Reward executives for achieving transactional, operational, financial and strategic objectives. | ||||||
| Long-Term Incentive | Performance Shares (RSAs) | Motivate executives to achieve pre-established financial goals, superior TSR performance and tailored individual goals consistent with the Company’s strategic plan. Provides retention benefits and enhanced | ||||||
| Other Benefits and Perquisites | Health, Welfare and Retirement Programs | Executives are generally eligible to participate in the same benefit programs that are offered to non-executive employees. Company benefits are designed to provide market competitive benefits to protect employees’ and their covered dependents’ health and welfare and provide retirement benefits. | ||||||
42
Base SalarySalary.. The base salary payable to each Named Executive Officer provides a fixed component of compensation that reflects the executive’s position and responsibilities. Base salary is generally targeted to approximate the competitive market median of the peer companies but may deviate from this target based on an individual’s sustained performance, contributions, leadership, experience, expertise and specific roles within the Company as compared to the benchmark data. The Compensation Committee reviews base salaries annually and may make adjustments to better match competitive market levels or to recognize an executive’s professional growth and development or increased responsibilities. The Compensation Committee also considers the success of each executive officer in developing and executing on strategic plans, exercising leadership and creating stockholdershareholder value.
In determining base salaries for the Named Executive Officers, the Compensation Committee analyzes base salary information of the peer companies. Although the Compensation Committee periodically considers information from REIT industry and other compensation surveys, it places primary emphasis on publicly available data from the peer companies’ proxy statements and other SEC filings, which is more detailed by individual executive officer position than the data typically provided in compensation surveys.
Annual Cash Incentive CompensationCompensation.. Named Executive Officers are provided with an annual opportunity to earn cash incentive awards. For each Named Executive Officer, annual cash incentive compensation reflects the achievement of pre-established measures related to transactional, operational, financial and strategic objectives that serve as the underlying assumptions in the Company’s stated earnings guidance such as NOI and rental revenue growth, operating margin improvement, the achievement of targeted development yields, quality external growth, and targeted dispositions. The Compensation Committee also considers each executive’s individual performance, departmental performance, and the overall performance of the Company.
Long-Term Equity Incentive CompensationCompensation. . The Compensation Committee and the independent members of the Board continually evaluate the long-term incentive plan in the context of the overall executive compensation program, the Company’s business needs and feedback from stockholders.shareholders. This process includes assessing the level of discretion permitted in evaluating the performance of and objectives achieved by the Named Executive Officers. The Compensation Committee has concluded that a significant portion of each Named Executive Officer’s long-term equity incentive awards will be determined based on the achievement of pre-established one and three-year quantitative performance metrics, as determined at the conclusion of a performance period, that are not subject to Compensation Committee discretion. These specific performance factors are aligned with the Company’s business strategy and current market conditions and are based on objective, quantifiable measures. Such factors include the Company's same store lease-up performance relative to student housing peers, absolute and relative TSR and FFOM per share achieved.
In addition, when assessing the weight that should be placed on discretionary and subjective measures of performance, the Compensation Committee also considers the importance of maintaining flexibility in the evaluation of long-term performance. While measuring performance relative to objective metrics is important and is a key part of the overall long-term incentive program, the Compensation Committee philosophically believes it is important to also assess more intangible accomplishments such as leadership development and overall execution of the Company’s mission and long-term strategic business plan which can include decisions that may impact the ability to meet certain objective metrics. Examples includeFor 2021, the Compensation Committee considered the Company’s performance and achievements despite the circumstances of the year continuing to be affected by the COVID-19 pandemic. The Compensation Committee believes the Company is well positioned to capitalize on future opportunities, due primarily to the extraordinary efforts of its employees and executive leadership. Another example is the strategic reinvestment in technology and systems and capital allocation decisions such as opportunistic dispositions of properties that were not originally contemplated when establishing objective compensation metrics for the year.systems. The flexibility permitted in the subjective portion of the compensation program allows management to adjust to meet rapidly changing market and business conditions and to act in the best interests of stockholdersshareholders to incentivize, create, and preserve, long-term value for the Company’s stakeholders. Additionally, the Compensation Committee believes that having rigid goals and formulaic determinations of performance for the entire long-term incentive opportunity may increase compensation risk by encouraging a narrow focus that may be inappropriate in light of these industry and strategic considerations.
When evaluating a suitable allocation between such objective and subjective measures of performance, the Compensation Committee concluded that a 50/50 split between a formulaic objective evaluation of performance and a more qualitative subjective evaluation provides the appropriate incentive structure and balance to drive long-term stockholdershareholder value and discourage excessive risk-taking. The Compensation Committee also considered that, as the only publicly traded student housing REIT, the Company is uniquely impacted by different market cycles as compared to other REITs, and in a constantly evolving business environment, certain of the objective performance measures may not be met for a fiscal year due to strategic business decisions made in the interest of long-term stockholdershareholder value. Additionally, the specialized nature of student housing involves a one-time annual lease-up process, managing customer service for a unique tenant base, continually fostering University relationships, and managing an employee base much larger than most companies of similar size due to the need for higher staffing levels (including student Community Assistants) at our properties. For these reasons, the Compensation
43
Committee deems it important to retain a certain level of discretion in evaluating performance, having the flexibility to discretionarily adjust incentive awards to take into account the Company’s unique and specialized dynamics. The Compensation Committee believes that this 50/50 approach is instrumental in driving consistent, superior total returns to stockholdersshareholders and limiting risk in the executive compensation program.
Unlike companies that grant equity awards on a prospective basis prior to performance, the Company’s long-term equity incentive plan is retrospective in nature, such that equity awards are granted following the satisfactiondetermination of specifiedachieved performance goals.results compared to preset performance goals and targets. Similar to annual cash incentive awards, the grant and value of long-term equity incentive awards are approved at the beginning of each fiscal year and determined solely by performance achieved inover the preceding fiscal year.applicable one and three-year performance periods. If threshold performance has not been achieved with respect to a performance goal for a particular performance period, the portion of the long-term equity incentive awards based on that performance goal is not granted for that period. Therefore, at the time of their grant, long-term equity incentive awards have been fully earned and are not subject to additional performance-based vesting requirements. These awards vest over a five-year period, furnishingTo promote retention benefits and creating significantcreate long-term alignment with stockholders
shareholders by incentivizing each Named Executive Officer to identify and accomplish long-term business objectives that generate value through stock price appreciation and dividend growth.growth, these awards are then subject to a five-year vesting period.

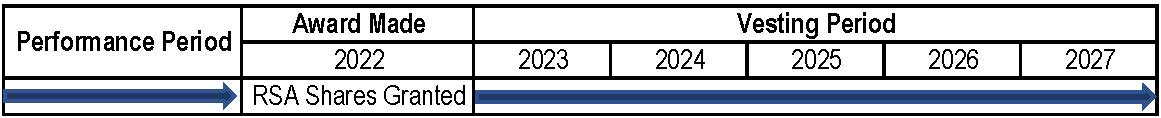
Because of the retrospective nature of the long-term equity incentive plan and the SEC’s disclosure rules, the 20202022 long-term equity incentive awards granted to Named Executive Officers do not appear in the 20192021 Summary Compensation Table, but will be reflected in next year’s Summary Compensation Table as RSAs granted in 2020.2022.
Compensation Consultant and Benchmarking
Independent Consultant and Benchmarking: The Compensation Committee retained Ferguson Partners Consulting L.P. (“FPC”) as its independent compensation consultant to advise on matters related to compensation levels and program design. As part of this analysis, FPC provided market data and compensation practice information on the peer group companies, and advised on trends and developments in executive compensation practices and philosophies generally. At the time of engagement, the Compensation Committee reviewed independence, and determined that FPC met the independence criteria under the Compensation Committee charter and that FPC’s engagement raised no conflict of interest.
Peer group: As the Company had maintained its prior peer group for several years, FPC recommended and the Compensation Committee agreed that it was prudent to reassess the composition of the Company’s peer group in 2021 to ensure the design and structure of the compensation program continues to be appropriate and consistent with market developments.
44
The Compensation Committee noted that the Company has no publicly traded direct business competitors, particularly when factoring in its specialization in student housing. The Compensation Committee, in consultation with FPC, therefore strove to formulate a peer group of publicly traded companies that include the following characteristics:
| Guiding Factors for Selecting ACC Peers | |||||
| Public Student Housing REITs | None – we are the only public student housing focused REIT. | ||||
| Industry and Business Strategy | Companies with similar business models, philosophies, and investment criteria, including companies that are classified within the FTSE Nareit Residential Index | ||||
| Size | Companies which are similar in size and scope, with the primary measure being total capitalization and leasable units under management | ||||
| Operational Intensity and Complexity | Companies with a comparable number of leasing units administered and similar complexity of diverse business activities and geographic reach or companies engaged in transactions of a similar complex nature, such as development activities, joint ventures, and public/private partnerships | ||||
| Competition | Companies that we compete with for executive talent, and companies that we compete with for investors and which key analysts name as a peer | ||||
| Other Considerations | Companies that cite us as a peer | ||||
Based on the analysis and considerations provided by FPC, the Compensation Committee determined that five legacy peers no longer most closely represented the characteristics noted above. Specifically:
•Extra Space Storage, Inc. and Tanger Factory Outlet Centers, Inc. no longer met the recommended size parameter
•Federal Realty Investment Trust did not meet the recommended operational intensity or industry parameters
•Weingarten Realty Investors did not meet the recommended industry parameter due to being acquired
•Apartment Investment and Management Company (AIV) no longer met the recommended size parameter, while Apartment Income REIT Corp. (AIRC), a spinoff of legacy AIV, met several of the characteristics and was recommended for inclusion
45
| Company Name | Asset Class (1) | Size | Existing Peer | Cite ACC as a Peer | ISS Peer | Operationally Intensive | ||||||||||||||
| American Homes 4 Rent | X | X | X | X | X | |||||||||||||||
| Apartment Income REIT Corp. | X | X | X (Aimco) | X (Aimco) | X | |||||||||||||||
| AvalonBay Communities, Inc. | X | X | X | |||||||||||||||||
| Camden Property Trust | X | X | X | X | X | X | ||||||||||||||
| CubeSmart | X | X | X | X | X | |||||||||||||||
| Equity LifeStyle Properties, Inc. | X | X | X | X | X | X | ||||||||||||||
| Equity Residential | X | X | X | |||||||||||||||||
| Essex Property Trust, Inc. | X | X | X | |||||||||||||||||
| Independence Realty Trust, Inc. | X | X | X | |||||||||||||||||
| Invitation Homes Inc. | X | X | X | |||||||||||||||||
| JBG SMITH Properties | X | X | ||||||||||||||||||
| Life Storage, Inc. | X | X | X | |||||||||||||||||
| Mid-America Apartment Communities, Inc. | X | X | X | |||||||||||||||||
| National Storage Affiliates Trust | X | X | ||||||||||||||||||
| OUTFRONT Media Inc. (REIT) | X | X | X | |||||||||||||||||
| Ryman Hospitality Properties, Inc. | X | X | X | X | X | |||||||||||||||
| Sun Communities, Inc. | X | X | X | X | X | |||||||||||||||
| UDR, Inc. | X | X | X | X | X | X | ||||||||||||||
| (1) Includes other residential companies as well as companies with a special focus. | ||||||||||||||||||||
As depicted above and based on the analysis and considerations provided by FPC, these 18 companies most closely represented the characteristics noted above. In order to ensure the goals outlined above were met, the Compensation Committee evaluated both the characteristics of each individual company as well as the composition of the peer group as a whole. The Compensation Committee also considered the Company’s specialization as the only student housing REIT with unique operational and market cycles, which, unlike the peer group companies, has fundamentals that drive the Company’s success in its business model but do not always correlate to broader macroeconomic trends. Additionally, the Company manages a student housing tenant base that is not directly comparable to the peer companies; as such, its operational characteristics and dynamics are unique. The following companies may individually demonstrate comparability in certain of the criteria noted above, but not all.
| - | + | |||||||||||||||||||
| COMPANIES REMOVED | COMPANIES ADDED | American Homes 4 Rent | Invitation Homes Inc. | |||||||||||||||||
| Apartment Investment and | American Homes 4 Rent | → | Apartment Income REIT Corp. | JBG SMITH Properties | ||||||||||||||||
| Management Company | Apartment Income REIT Corp. | AvalonBay Communities, Inc. | Life Storage, Inc. | |||||||||||||||||
| ExtraSpace Storage, Inc. | Independence Realty Trust, Inc. | Camden Property Trust | Mid-America Apartment Communities, Inc. | |||||||||||||||||
| Federal Realty Investment Trust | JBG SMITH Properties | CubeSmart | National Storage Affiliates Trust | |||||||||||||||||
| Tanger Factory Outlet Centers, Inc. | Life Storage, Inc. | Equity LifeStyle Properties, Inc. | OUTFRONT Media Inc. (REIT) | |||||||||||||||||
| Weingarten Realty Investors | National Storage Affiliates Trust | Equity Residential | Ryman Hospitality Properties, Inc. | |||||||||||||||||
| OUTFRONT Media Inc. | Essex Property Trust, Inc. | Sun Communities, Inc. | ||||||||||||||||||
| Independence Realty Trust, Inc. | UDR, Inc. | |||||||||||||||||||
After the peer group was finalized, the Compensation Committee consulted with FPC to provide an evaluation of the Company’s overall compensation program design, considering the new peer group. As part of this analysis, FPC provided market data and compensation practice information on the new peer group companies, and advised on trends and developments in executive compensation practices and philosophies generally.
46
2021 Executive Compensation
As noted earlier, and in the context of 2021 compensation, it is worth acknowledging that the Company’s 2021 outlook, and therefore the financial metrics used to assess management’s performance for 2021, were below the actual results produced for 2020. This was due to the ongoing impact of the pandemic on the 2020-2021 academic year occupancy at the Company’s properties, which affected a significant portion of 2021, and the gradual return to normal operations that was expected to occur over two academic year cycles.
The Compensation Committee considered all of the factors established under the executive compensation program for 20192021 and has discretion to consider other relevant factors, although it places the greatest emphasis on the factors noted in the “2019“2021 Base Salary,” “2019“2021 Annual Cash Incentive Awards” and “2019“2021 Long-Term Equity Incentive Awards” sections below.
2021 Base Salary.Base salary + annual cash incentive award + long-term equity incentive award)for 2021 was unchanged from that paid in 2020.
| Base Salary | Year-Over-Year % Change | |||||||||||||||||||||||||
| 2021 | 2020 | |||||||||||||||||||||||||
| William C. Bayless, Jr. | $ | 822,000 | $ | 822,000 | 0.0 | % | ||||||||||||||||||||
| Jennifer Beese | $ | 550,000 | (1) | $ | 445,600 | 23.4 | % | |||||||||||||||||||
| William W. Talbot | $ | 466,700 | $ | 466,700 | 0.0 | % | ||||||||||||||||||||
| Daniel B. Perry | $ | 445,600 | $ | 445,600 | 0.0 | % | ||||||||||||||||||||
| Kim K. Voss | $ | 343,700 | $ | 343,700 | 0.0 | % | ||||||||||||||||||||
(1) Represents base salary upon Ms. Beese's promotion to President and Chief Operating Officer, effective August 24, 2021.
2021 Annual Cash Incentive Awards. At the beginning of each active Named Executive Officer for 2019, 2018 and 2017, consistent with the manner in which2021, the Compensation Committee evaluates executivereviewed the market compensation benchmarks provided by its independent compensation consultant and pay-for-performance alignment. This table differs fromset the following threshold, target and maximum cash incentive opportunities for 2021 performance to maintain competitiveness of our compensation reported inprogram with the 2019 Summary Compensation Table in that it reflects the value ofmarket pay levels and to reflect executives’ individual performance over time, internal pay equity and other factors for our Named Executive Officers’ long-term equity incentive awards inOfficers, other than Ms. Voss. The Compensation Committee determined Ms. Voss’s 2021 compensation based on the performance year for which they were earned, rather than the year in which they were granted (e.g., long-term equity incentive awards granted in January 2020 for 2019 performance are shown in the table below as 2019 compensation). While compensation reported in the 2019 Summary Compensation Table is useful, the SEC’s disclosure rules do not take into account the retrospective natureCommittee’s judgment of the Company’s executive compensation program and therefore create a one-year lag between the value of Named Executive Officers’ long-term equity incentive awardsher overall performance and the performance year forof the group over which they were earned (e.g., long-term equity incentive awards granted in January 2020 for 2019 performance will not be shown in the Summary Compensation Table until the 2021 Proxy Statement as 2020 compensation). This table supplements, and does not replace, the 2019 Summary Compensation Table.she has direct responsibility.
| Name | Performance Year | Salary | Annual Cash Incentive Award | Value of Long-Term Equity Incentive Award | Total Direct Compensation(1) | |||||||||||||
| William C. Bayless, Jr. | 2019 | $ | 800,000 | $ | 1,275,000 | $ | 4,532,400 | $ | 6,607,400 | |||||||||
| 2018 | 790,500 | 1,100,000 | 3,230,000 | 5,120,500 | ||||||||||||||
| 2017 | 775,000 | 875,000 | 2,325,000 | 3,975,000 | ||||||||||||||
| William W. Talbot | 2019 | $ | 453,100 | $ | 800,000 | $ | 1,699,650 | $ | 2,952,750 | |||||||||
| 2018 | 394,000 | 625,000 | 1,070,000 | 2,089,000 | ||||||||||||||
| 2017 | 382,500 | 450,000 | 765,000 | 1,597,500 | ||||||||||||||
| Jennifer Beese | 2019 | $ | 432,600 | $ | 750,000 | $ | 1,636,700 | $ | 2,819,300 | |||||||||
| 2018 | 360,500 | 600,000 | 980,000 | 1,940,500 | ||||||||||||||
| 2017 | 350,000 | 450,000 | 700,000 | 1,500,000 | ||||||||||||||
| James C. Hopke, Jr. | 2019 | $ | 475,000 | $ | 650,000 | $ | 1,353,425 | $ | 2,478,425 | |||||||||
| 2018 | 463,500 | 550,000 | 1,260,000 | 2,273,500 | ||||||||||||||
| 2017 | 450,000 | 450,000 | 850,000 | 1,750,000 | ||||||||||||||
| Daniel B. Perry | 2019 | $ | 432,600 | $ | 650,000 | $ | 1,353,425 | $ | 2,436,025 | |||||||||
| 2018 | 360,500 | 550,000 | 980,000 | 1,890,500 | ||||||||||||||
| 2017 | 350,000 | 450,000 | 700,000 | 1,500,000 | ||||||||||||||
| Cash Incentive Opportunity | ||||||||||||||||||||||||||||||||
| Executive | Threshold | Target | Maximum | |||||||||||||||||||||||||||||
| William C. Bayless, Jr. | $ | 675,000 | $ | 1,350,000 | $ | 2,025,000 | ||||||||||||||||||||||||||
| Jennifer Beese | $ | 425,000 | $ | 850,000 | $ | 1,275,000 | ||||||||||||||||||||||||||
| William W. Talbot | $ | 425,000 | $ | 850,000 | $ | 1,275,000 | ||||||||||||||||||||||||||
| Daniel B. Perry | $ | 350,000 | $ | 700,000 | $ | 1,050,000 | ||||||||||||||||||||||||||
47
| Base Salary | Year-Over-Year % Change | ||||||||
| 2019 | 2018 | ||||||||
| William C. Bayless, Jr. | $ | 800,000 | $ | 790,500 | 1.2% | ||||
| William W. Talbot | $ | 453,100 | $ | 394,000 | 15.0% | ||||
| Jennifer Beese | $ | 432,600 | $ | 360,500 | 20.0% | ||||
| James C. Hopke, Jr. | $ | 475,000 | $ | 463,500 | 2.5% | ||||
| Daniel B. Perry | $ | 432,600 | $ | 360,500 | 20.0% | ||||
| Cash Incentive Opportunity | |||||||||||||
| Executive | Threshold | Target | Maximum | ||||||||||
| William C. Bayless, Jr. | $637,500 | $1,275,000 | $1,912,500 | ||||||||||
| William W. Talbot | $400,000 | $800,000 | $1,200,000 | ||||||||||
| Jennifer Beese | $375,000 | $750,000 | $1,125,000 | ||||||||||
| James C. Hopke, Jr. | $325,000 | $650,000 | $975,000 | ||||||||||
| Daniel B. Perry | $325,000 | $650,000 | $975,000 | ||||||||||
| Goals | Actual | |||||||||||||||||||
| Threshold | Target | Maximum | Performance | |||||||||||||||||
| Owned property NOI $ | $424.4 million | $440.6 million | $456.7 million | $481.4 million | ||||||||||||||||
| FFOM $ | $241.9 million | $261.6 million | $281.2 million | $300.6 million | ||||||||||||||||
| Same store NOI growth for full year 2021 compared to 2020 | (3.8) | % | (0.7) | % | 2.5 | % | 5.2% | |||||||||||||
| Same store rental revenue growth for Fall 2021 lease-up | 4.6 | % | 7.3% | 9.9 | % | 10.1% | ||||||||||||||
| Same store operating margin | 52.0 | % | 52.9% | 53.8 | % | 54.3% | ||||||||||||||
| Capital sourcing during 2021 consistent with the Company's strategic business plan | $60.0 million | n/a | $125.0 million | $331.4 million | ||||||||||||||||
| Response to COVID-19 challenges and working with university partners to re-stabilize the Company's operations | n/a | n/a | n/a | See discussion following | ||||||||||||||||
| Goals | Actual | ||||||
| Threshold | Target | Maximum | Performance | ||||
| Owned property NOI $ | $482.8 million | $487.4 million | $492.0 million | $490.0 million | |||
| FFOM $ | $325.9 million | $333.3 million | $340.0 million | $336.2 million | |||
| Same store NOI growth for full year 2019 compared to 2018 | 1.6% | 2.5% | 3.4% | 2.7% | |||
| Same store rental revenue growth for Fall 2019 lease-up | 1.5% | 2.25% | 3.0% | 1.7% (1) | |||
| Same store operating margin | 54.4% | 54.7% | 55.0% | 55.3% | |||
| Year 1 yields on 2019 developments | n/a | 6.3% | n/a | 6.3% | |||
| Rental revenue growth for 2019 / 2020 academic year for 2018 developments | n/a | 3.9% | n/a | 3.6% | |||
| External growth during 2019 consistent with the Company’s strategic business plan | n/a | n/a | n/a | $358.0 million | |||
| Joint ventures and/or dispositions during 2019 | $100 million | n/a | $190 million | $109.5 million | |||
48 |
| NAMED EXECUTIVE OFFICER | INDIVIDUAL AND DEPARTMENTAL PERFORMANCE | |||||||
| William C. Bayless, Jr. | • | |||||||
| • | ||||||||
| • | Ensured collaborative stakeholder communication | |||||||
| • | ||||||||
| Jennifer Beese | • | Provided outstanding leadership of our operations and leasing teams, including employment of our Next Gen operating systems to execute record levels of spring 2021 mid-term leases, helping to further renormalize our business early in the year. | ||||||
| • | Successfully completed the annual Fall lease-up of the Company’s portfolio, thereby re-stabilizing our operations and achieving results exceeding the high end of our guidance and outperforming our student housing peers. | |||||||
| • | Expanded the Company’s support of the ‘Hi, How Are You?’ mental health awareness project, pioneered our College Student 2021 Mental Wellness Survey and advanced our Diversity and Inclusion Committee, in support of our residents and employee wellbeing through our ESG initiatives. | |||||||
| William W. Talbot | • | |||||||
With Mr. Perry, | ||||||||
| • | Continued to advance the Company's on and off-campus development pipeline and | |||||||
| • | Expanded the Company's successful public-private partnership business with university clients, resulting in | |||||||
| Daniel B. Perry | • | Provided leadership and | ||||||
| • | Developed and deployed analytical benchmarking tools to assess productivity metrics that were utilized in conjunction with Next Gen budgeting and forecasting tools, allowing for earlier executive review and opportunity to implement cost control initiatives. | |||||||
| • | Advancement of the Company's corporate | |||||||
49
After taking all quantitative factors into account as well as each Named Executive Officer’s individual and department accomplishments, the Compensation Committee determined that the 20192021 cash incentive awards are as follows:follows (other than Ms. Voss), which, in total, represents 148% of target. The Compensation Committee determined Ms. Voss’s 2021 compensation based on the Compensation Committee’s judgment of her overall performance and the performance of the group over which she has direct responsibility.
| Award | Award | Percent of Target | ||||||||||||
| William C. Bayless, Jr. | $ | 1,275,000 | William C. Bayless, Jr. | $ | 1,960,000 | 145 | % | |||||||
| Jennifer Beese | Jennifer Beese | $ | 1,275,000 | 150 | % | |||||||||
| William W. Talbot | $ | 800,000 | William W. Talbot | $ | 1,275,000 | 150 | % | |||||||
| Jennifer Beese | $ | 750,000 | ||||||||||||
| James C. Hopke, Jr. | $ | 650,000 | ||||||||||||
| Daniel B. Perry | $ | 650,000 | Daniel B. Perry | $ | 1,050,000 | 150 | % | |||||||
| Kim K. Voss | Kim K. Voss | $ | 475,000 | n/a | ||||||||||
2021 Long-Term Equity Incentive AwardsAwards. . Our program measures performance over a trailing 1- and 3-year period and compensates our executives for performance delivered over this period through a long-term restricted stock grant. To date, the Compensation Committee has determined that the awards will vest over five years, and believes that this is the best way to align performance with payouts, creates long-term shareholder-aligning retentive impacts on our executives, and is in the best interests of shareholders.
As set forth below, 50% of each Named Executive Officer’s (other than Ms. Voss) annual long-term equity incentive award for 2019 performance was based on four pre-established quantitative goals where achievement was not subject to the Compensation Committee’s discretion, and the other 50% was based on the Compensation Committee’s subjective consideration of performance related to pre-established management objectives as well as performance in advancing the Company’s long-term strategic business plan duringplan. The Compensation Committee determined Ms. Voss’s 2021 compensation based on the year. Compensation Committee’s judgment of her overall performance and the performance of the group over which she has direct responsibility.
Awards are expressed as a fixed dollar amount at threshold, target and highmaximum levels and, to the extent performance fell between two levels with respect to any quantitative metric, linear interpolation was applied. If actual performance did not meet the threshold requirement, no awards were earned for the applicable metric. If actual performance is above the maximum for a metric, the award is the maximum number for the participant’s opportunity.
Awards are granted in the form of RSAs based on the dollar value of the earned award, which is converted into the number of RSAs based on the closing price of the Company’s common stock on the date of grant.
Similar to the annual cash incentive award opportunity, the Compensation Committee set the following threshold, target and maximum long-term equity incentive opportunities for 2021 performance based upon market data from our independent compensation consultant, individual performance over time, internal pay equity and other factors.
| Long-Term Incentive Opportunity | ||||||||||||||||||||||||||
| Executive | Threshold | Target | Maximum | |||||||||||||||||||||||
| William C. Bayless, Jr. | $ | 1,925,000 | $ | 3,850,000 | $ | 5,775,000 | ||||||||||||||||||||
| Jennifer Beese | $ | 750,000 | $ | 1,500,000 | $ | 2,250,000 | ||||||||||||||||||||
| William W. Talbot | $ | 700,000 | $ | 1,400,000 | $ | 2,100,000 | ||||||||||||||||||||
| Daniel B. Perry | $ | 650,000 | $ | 1,300,000 | $ | 1,950,000 | ||||||||||||||||||||
50
| Long-Term Incentive Opportunity | |||||||||||||
| Executive | Threshold | Target | Maximum | ||||||||||
| William C. Bayless, Jr. | $1,800,000 | $3,600,000 | $5,400,000 | ||||||||||
| William W. Talbot | $675,000 | $1,350,000 | $2,025,000 | ||||||||||
| Jennifer Beese | $650,000 | $1,300,000 | $1,950,000 | ||||||||||
| James C. Hopke, Jr. | $537,500 | $1,075,000 | $1,612,500 | ||||||||||
| Daniel B. Perry | $537,500 | $1,075,000 | $1,612,500 | ||||||||||
| Targets | Actual Performance | Percent of Target | |||||||||||||||||||||||||||||||||
| Metric | Weighting | Threshold | Target | Maximum | |||||||||||||||||||||||||||||||
| GOAL 1: | |||||||||||||||||||||||||||||||||||
| 2021 Absolute TSR | 10% | 4.0% | 8.0% | 12.0% | 34.3% | 429% | |||||||||||||||||||||||||||||
| GOAL 2: | |||||||||||||||||||||||||||||||||||
2019-2021 Relative TSR vs. MSCI US REIT Index - 3 years (1) | 10% | 25th percentile | 50th percentile | 75th percentile | 59th percentile | 118% | |||||||||||||||||||||||||||||
| GOAL 3: | |||||||||||||||||||||||||||||||||||
| 2021 FFOM per share-diluted | 10% | $1.73 | $1.87 | $2.01 | $2.14 | 114% | |||||||||||||||||||||||||||||
| GOAL 4: | |||||||||||||||||||||||||||||||||||
| 2021 same store lease-up performance versus student housing competitive properties | 20% | 0.5% | 1.0% | 1.75% | 0.75% | 75% | |||||||||||||||||||||||||||||
| Objective Criteria | 50% | ||||||||||||||||||||||||||||||||||
| GOAL 5: | |||||||||||||||||||||||||||||||||||
| Subjective Criteria | 50% | Subject to the determination of the | Varies | ||||||||||||||||||||||||||||||||
| Compensation Committee | |||||||||||||||||||||||||||||||||||
| 100% | |||||||||||||||||||||||||||||||||||
(1)The relative TSR comparison was measured against the total return version of the MSCI US REIT Index (RMS) for the three years ended December 31, 2021.
| Targets | Actual Performance | ||||||||||
| Metric | Weighting | Threshold | Target | Maximum | |||||||
| GOAL 1: | |||||||||||
| 2019 Absolute TSR | 10% | 4% | 8% | 12% | 18.3% | ||||||
| GOAL 2: | |||||||||||
2019 Relative TSR vs. MSCI US REIT Index - 3 years(1) | 10% | 25th percentile | 50th percentile | 75th percentile | 32nd percentile | ||||||
| GOAL 3: | |||||||||||
| 2019 FFOM per share-diluted | 10% | $2.30 | $2.40 | $2.45 | $2.42 | ||||||
| GOAL 4: | |||||||||||
2019 same store lease-up performance versus student housing competitive properties | 20% | 0.5% | 1.0% | 1.75% | 2.8% | ||||||
| Objective Criteria | 50% | ||||||||||
| GOAL 5: | |||||||||||
| Subjective Criteria | 50% | Subject to the determination of the | |||||||||
| Compensation Committee | |||||||||||
| 100% | |||||||||||
GOAL 1: Absolute Total StockholderShareholder Return
Why does this measure matter? TSR is the most direct measure of creation and preservation of stockholdershareholder value.
Result:The Company delivered TSR of 18.3%34.3% in 2019,2021, which was above the high endmaximum range, resulting in a payout of the range.150% of target for Goal 1.
GOAL 2: Relative Total StockholderShareholder Return vs. RMS Index
Why does this measure mattermatter?? By utilizing a relative measure of TSR performance over a three-year period, the impact of broader market or industry trends that do not directly reflect the Company’s actual performance are mitigated.
Result:TSR of 7.0%39.4% for the three years ended December 31, 20192021 was in the 32nd 59th percentile, which was between the thresholdtarget and targetmaximum levels of the range.range, resulting in a payout of 118% of target for Goal 2.
GOAL 3: Company Financial Measures — FFOM Per Share
Why does this measure matter?FFO is a common measure of operating performance for REITs because it excludes, among other items, the effect of gains and losses from real estate sales and real estate depreciation and amortization to allow investors, analysts and management to compare operating performance among companies and across time periods on a consistent basis. We also believe it is meaningful to present a measure we refer to as FFOM, which reflects certain adjustments to FFO related to the economic performance of our on-campus participating properties. When calculating FFOM, the Company also excludes property acquisition costs and other non-cash items, as determined in good faith.faith that do not reflect our core operations on a comparative basis. FFOM is presented because the Company considers it an important supplemental measure of operating performance and believes it is used by securities analysts, investors and other interested parties in the evaluation of the Company’s performance across time periods. A reconciliation of net income to FFO and FFOM for the year ended December 31, 2019, 2021,
51
is contained in the Company’s 20192021 Annual Report on Form 10-K and in the earnings release furnished on a Current Report on Form 8-K filed on February 19, 2020.22, 2022.
Result:In 2019,2021, the Company achieved FFOM of $2.42$2.14 per fully diluted share, which was betweenabove the maximum range, resulting in a payout of 150% of target and high end of the rangefor Goal 3.
GOAL 4: Company Performance - Lease-Up Results Relative to Student Housing Peers
Why does this measure mattermatter? ? The Company’s results of operations are significantly dependent upon the results of an annual lease-up period, including occupancy levels and rental rate growth achieved. Lease-up performance relative to competitive student housing properties in same store markets is the most direct measure of performance and reduces the influence of external factors on occupancy and rental rate not within management’s control. As the Company has no publicly traded direct business competitors specialized in student housing, this measure compares the Company’s achieved same store rental rate growth and occupancy in its same store markets as of September 30, 20192021 versus the average rental rate growth and occupancy achieved by student housing properties located within one-half mile in those same markets, as measured and reported by an independent data provider of student housing statistics.
Result: The Company achieved same store occupancy and rental rate growth that outperformed student housing peers by 2.80.75 percentage points in the 2019-20202021-2022 academic year lease-up as of September 30, 2019,2021, which was abovebetween the high endthreshold and target levels of the range.range, resulting in a payout of 75% of target for Goal 4.
SUMMARY: Objective Criteria
The Named Executive Officers earned awards ranging from 75% to 150% of the target opportunity for alleach of the four objective metrics which were calculated based on the weighting of each metric as a percent of the long-term incentive opportunity and the level of performance achieved. As discussed above, when 20192021 performance fell between two levels with respect to any metric, linear interpolation was applied.
GOAL 5: Individual Performance Under Management Objectives
Established by the Compensation Committee for Named Executive Officers
Why does this measure matter?A review of each Named Executive Officer’s annual accomplishments, both individually and respectively in relation to Company-wide accomplishments, enables the Compensation Committee to evaluate the specific contributions of the Named Executive Officer to the Company’s success and more closely link pay to performance.
Result:As determined by the Compensation Committee, each Named Executive Officer achieved between the target and maximum performance with respect to the tailored individual objectives designed to advance the Company’s long-term strategic initiatives, which represented 50% of the long-term equity incentive award opportunity. The significant accomplishments considered by the Compensation Committee in determining the subjective individual performance component of the Named Executive Officers’ 2019(other than Ms. Voss) 2021 awards are discussed below.
52
| NAMED EXECUTIVE OFFICER | STRATEGIC INITIATIVE ADVANCEMENTS | |||||||
| William C. Bayless, Jr. | • | |||||||
| • | Reinforced the Company’s culture of excellence, collaboration and | |||||||
| • | ||||||||
| • | Advanced the | |||||||
| • | Energized | |||||||
| • | ||||||||
| Jennifer Beese | • | |||||||
| • | Oversaw establishment of the new Executive Vice President, Chief Purpose and | |||||||
| • | Continued to deploy and enhance the Company’s | |||||||
| William W. Talbot | • | |||||||
| • | Continued to expand the Company's successful public-private partnership business with university clients, | |||||||
| • | ||||||||
| joint venture partners. | ||||||||
| Daniel B. Perry | • | Employed a prudent | ||||||
| • | Closely collaborated with the Capital Allocation Committee in evaluating historic investments and capital sourcing and deployment and evaluating market opportunities to maximize earnings and Net Asset Value (NAV) growth, and with Mr. Talbot, continued to advance the Company’s Pursue Growth 2030 initiative and associated Strategic Capital Platform and develop relationships with potential institutional and joint venture partners. | |||||||
| • | With | |||||||
53
For quantitative goals 1 through 4, after applying their respective weights, a payout of 114% of target in total for those four goals was earned. Goal 5 was earned at approximately 125% for our CEO and 138% for our other NEOs (other than Ms. Voss) due to their strong organizational, operational, financial, and strategic leadership.
As a result of evaluating the achievement of the quantitative performance metrics and each executive's advancement of the strategic initiatives outlined above and their performance re-stabilizing the Company’s operations amidst the COVID-19 pandemic, the Compensation Committee approveddetermined that the following 20192021 long-term equity incentive awards.awards are as follows (other than Ms. Voss), which, in total, represents 119% - 126% of target. The Compensation Committee determined Ms. Voss’s 2021 compensation based on the Compensation Committee’s judgment of her overall performance and the performance of the group over which she has direct responsibility.
| Award | ||||||||
| William C. Bayless, Jr. | $ | 4,593,050 | ||||||
| Jennifer Beese | $ | 1,833,250 | ||||||
| William W. Talbot | $ | 1,757,700 | ||||||
| Daniel B. Perry | $ | 1,632,150 | ||||||
| Kim K. Voss | $ | 525,000 | ||||||
54
| Award | |||
| William C. Bayless, Jr. | $ | 4,532,400 | |
| William W. Talbot | $ | 1,699,650 | |
| Jennifer Beese | $ | 1,636,700 | |
| James C. Hopke, Jr. | $ | 1,353,425 | |
| Daniel B. Perry | $ | 1,353,425 | |
The table below sets forth total direct compensation (base salary + annual cash incentive award + long-term equity incentive award) of each active Named Executive Officer for 2021, 2020 and 2019, consistent with the manner in which the Compensation Committee evaluates executive compensation and pay-for-performance alignment. This table differs from compensation reported in the 2021 Summary Compensation Table in that it reflects the value of Named Executive Officers’ long-term equity incentive awards in the performance year for which they were earned, rather than the year in which they were granted (e.g., long-term equity incentive awards granted in January 2022 for 2021 performance are shown in the table below as 2021 compensation). While compensation reported in the 2021 Summary Compensation Table is useful, the SEC’s disclosure rules do not take into account the retrospective nature of the Company’s executive compensation program and therefore create a one-year lag between the value of Named Executive Officers’ long-term equity incentive awards and the performance year for which they were earned (e.g., long-term equity incentive awards granted in January 2022 for 2021 performance will not be shown in the Summary Compensation Table until the 2023 Proxy Statement as 2022 compensation). This table supplements, and does not replace, the 2021 Summary Compensation Table.
| Name | Performance Year | Salary | Annual Cash Incentive Award | Value of Long-Term Equity Incentive Award | Total Direct Compensation(1) | |||||||||||||||||||||||||||
| William C. Bayless, Jr. | 2021 | $ | 822,000 | $ | 1,960,000 | $ | 4,593,050 | $ | 7,375,050 | |||||||||||||||||||||||
| Chief Executive | 2020 | 822,000 | 956,250 | 3,400,000 | 5,178,250 | |||||||||||||||||||||||||||
| Executive Officer | 2019 | 800,000 | 1,275,000 | 4,532,400 | 6,607,400 | |||||||||||||||||||||||||||
| Jennifer Beese | 2021 | $ | 482,773 | (2) | $ | 1,275,000 | $ | 1,833,250 | $ | 3,591,023 | ||||||||||||||||||||||
| President, | 2020 | 445,600 | 600,000 | 1,405,733 | 2,451,333 | |||||||||||||||||||||||||||
| Chief Operating Officer | 2019 | 432,600 | 750,000 | 1,636,700 | 2,819,300 | |||||||||||||||||||||||||||
| William W. Talbot | 2021 | $ | 466,700 | $ | 1,275,000 | $ | 1,757,700 | $ | 3,499,400 | |||||||||||||||||||||||
| Executive Vice President, | 2020 | 466,700 | 600,000 | 1,459,800 | 2,526,500 | |||||||||||||||||||||||||||
| Chief Investment Officer | 2019 | 453,100 | 800,000 | 1,699,650 | 2,952,750 | |||||||||||||||||||||||||||
| Daniel B. Perry | 2021 | $ | 445,600 | $ | 1,050,000 | $ | 1,632,150 | $ | 3,127,750 | |||||||||||||||||||||||
| Executive Vice President, | 2020 | 445,600 | 600,000 | 1,162,433 | 2,208,033 | |||||||||||||||||||||||||||
| Chief Financial Officer, | 2019 | 432,600 | 650,000 | 1,353,425 | 2,436,025 | |||||||||||||||||||||||||||
| Treasurer and Secretary | ||||||||||||||||||||||||||||||||
| Kim K. Voss | 2021 | $ | 343,700 | $ | 475,000 | $ | 525,000 | $ | 1,343,700 | |||||||||||||||||||||||
| Executive Vice President, | 2020 | 343,700 | 331,250 | 450,000 | 1,124,950 | |||||||||||||||||||||||||||
| Chief Accounting Officer, and | 2019 | 333,700 | 375,000 | 500,000 | 1,208,700 | |||||||||||||||||||||||||||
| Assistant Secretary | ||||||||||||||||||||||||||||||||
(1)Total direct compensation consists of base salary, annual cash incentive awards and long-term equity incentive awards for the respective performance year. It does not include amounts shown in the “All Other Compensation” column of the 2021 Summary Compensation Table.
(2)Represents prorated total base salary received in 2021 including increase in base salary upon Ms. Beese's promotion to President and Chief Operating Officer, effective August 24, 2021.
Other Benefits and Perquisites
The Company’s executive compensation program focuses on the elements described above, with extremely limited provision of perquisites. The Named Executive Officers are generally eligible to participate in the same benefit programs offered to other employees. We believe these benefits are competitive with overall market practices.
55
Severance Benefits
The Named Executive Officers are entitled to receive severance benefits under existing agreements upon certain qualifying terminations of employment (subject to any required payment delay pursuant to Section 409A of the Internal Revenue Code). Generally, these severance arrangements support executive retention and continuity of management and provide replacement income if an executive is terminated involuntarily other than for cause.
None of the Company’s executive officers are entitled to severance benefits solely upon a change of control of the Company. Although a longstanding legacy arrangementsarrangement with Messrs.Mr. Bayless and Hopke provideprovides certain tax gross-ups with respect to payments made in connection with a change of control, consistent with the Company’s commitment to strong corporate governance and responsiveness to stockholders,shareholders, the Board subsequently adopted
a policy prohibiting tax gross-up arrangements, which formalized the Company’s existing practice of not entering into new tax gross-up arrangements with executive officers. This policy was filed on a Current Report on Form 8-K on April 27, 2010.
Policy with Respect to the $1 Million Deduction Limit
Section 162(m) of the Internal Revenue Code limits the deductibility on the Company’s tax return of compensation over $1 million to any of the Named Executive Officers. To the extent compensation does not qualify for deduction under section 162(m), a larger portion of stockholdershareholder distributions may be subject to federal income taxation as dividend income rather than return of capital. The Company does not believe section 162(m) will materially affect the taxability of stockholdershareholder distributions, although no assurance can be given in this regard due to the variety of factors that affect the tax position of each stockholder.shareholder. For these reasons, the Compensation Committee’s compensation policy and practices are not directly governed by section 162(m).
Employment Agreements
The Company has entered into employment agreements with certain key employees, including all of the Named Executive Officers, when the Compensation Committee determines an employment agreement is desirable for the Company to obtain a measure of assurance as to the executive’s continued employment in light of prevailing market competition for the particular position held by the executive officer, or where the Compensation Committee determines an employment agreement is necessary and appropriate to attract an executive in light of market conditions, the prior experience of the executive or practices at the Company with respect to other similarly situated employees. These employment agreements are more fully described below under “Employment Contracts” and “Potential Payments Upon Termination or Change in Control.”
Robust Stock Ownership Policy
Our executive officers and certain other executives are strongly encouraged to maintain a minimum equity stake in the Company. This policy embodies our Compensation Committee’s belief that our most senior executives should maintain a significant personal financial stake in the Company to promote a long-term perspective in managing our business. In addition, the policy helps align executive and shareholder interests, which reduces incentive for excessive short-term risk taking. Each covered executive is required to acquire and maintain ownership of shares of the Company’s common stock having a market value equal to or greater than the following amounts within three years of becoming a senior officer:
| Chief Executive Officer | 6 times annual base salary | |||||||
| President or Executive Vice President | 3 times annual base salary | |||||||
| Senior Vice President | 1 times annual base salary | |||||||
In 2021, each of our Named Executives complied with our stock ownership policy.
56
Policy Regarding Clawbacks to Recoup Compensation
If the Company is required to prepare an accounting restatement due to material non-compliance with any financial reporting requirement, then the Compensation Committee may require the Named Executive Officers to repay to the Company “Excess Compensation,” which is defined as that part of the annual cash bonus and long termlong-term equity incentive compensation received by that officer during the two-year period preceding the publication of the restated financial statement that the Compensation Committee determines was in excess of the amount that such officer would have received had such compensation been calculated based on the financial results reported in the restated financial statements.
The Compensation Committee may take into accountconsider any factors it deems reasonable in determining whether to seek recoupment of previously paid Excess Compensation and how much Excess Compensation to recoup from individual officers (which need not be the same amount or proportion for every officer), including any conclusion by the Compensation Committee that an officer engaged in wrongdoing or committed grossly negligent acts or omissions. The amount and form of the compensation to be recouped will be determined by the Compensation Committee in its discretion, and recoupment of compensation paid as annual cash bonuses or long termlong-term incentives may be made, in the Compensation Committee’s discretion, through cancellation of vested or unvested restricted stock awards and/or cash repayment.
Deferred Compensation Plan
Effective January 1, 2015, the Compensation Committee established a deferred compensation plan for the benefit of senior officers, directors and other key employees in which the participant may elect to defer cash compensation and/or equity awards granted under share incentive plans. A participant has a fully vested right to his or her cash deferral amounts and the vested deferred equity awards.
Risk Considerations
In establishing and reviewing the executive compensation program, including engagement with the independent compensation consultant, the Compensation Committee considers whether the program encourages unnecessary or excessive risk-taking and has concluded that it does not. Executives’ base salaries are fixed in amount and thus do not encourage risk-taking. The majority of compensation provided to the executive officers is in the form of equity awards which typically vest over a period of five years and further align executives’ interests with those of stockholders.shareholders. The Compensation Committee believes that by structuring the program such that a considerable amount of the wealth of executives is tied to the Company’s long-term health, it avoids the type of disproportionately large short-term incentives which could encourage executives to take risks not in the Company’s long-term interests. We believe this combination of factors encourages executives and other employees to manage the Company in a prudent manner.
57
Summary Compensation Table
The table below summarizes the total compensation paid or earned by each of the Named Executive Officers for the three years ended December 31, 2021, 2020 and 2019. The Company has entered into employment agreements with each of the Named Executive Officers. Such employment agreements are described below under “Employment Contracts.”
| Non-Equity | |||||||||||||||||||||||||||||||||||||||||||||||
| Name and Principal | Stock | Incentive Plan | All Other | ||||||||||||||||||||||||||||||||||||||||||||
| Position | Year | Salary | Bonus | Awards (1) | Compensation(2) | Compensation | Total | ||||||||||||||||||||||||||||||||||||||||
| William C. Bayless, Jr. | 2021 | $ | 822,000 | $ | — | $ | 3,400,000 | $ | 1,960,000 | $ | 594,638 | (3) | $ | 6,776,638 | |||||||||||||||||||||||||||||||||
| Chief Executive | 2020 | 822,000 | — | 4,532,400 | 956,250 | 564,792 | (4) | 6,875,442 | |||||||||||||||||||||||||||||||||||||||
| Executive Officer | 2019 | 800,000 | — | 3,230,000 | 1,275,000 | 497,845 | (5) | 5,802,845 | |||||||||||||||||||||||||||||||||||||||
| Jennifer Beese | 2021 | $ | 482,773 | (6) | $ | — | $ | 1,405,733 | $ | 1,275,000 | $ | 167,481 | (3) | $ | 3,330,987 | ||||||||||||||||||||||||||||||||
| President, | 2020 | 445,600 | — | 1,636,700 | 600,000 | 137,637 | (4) | 2,819,937 | |||||||||||||||||||||||||||||||||||||||
| Chief Operating Officer | 2019 | 432,600 | — | 980,000 | 750,000 | 96,994 | (5) | 2,259,594 | |||||||||||||||||||||||||||||||||||||||
| William W. Talbot | 2021 | $ | 466,700 | $ | — | $ | 1,459,800 | $ | 1,275,000 | $ | 188,980 | (3) | $ | 3,390,480 | |||||||||||||||||||||||||||||||||
| Executive Vice President, | 2020 | 466,700 | — | 1,699,650 | 600,000 | 170,133 | (4) | 2,936,483 | |||||||||||||||||||||||||||||||||||||||
| Chief Investment Officer | 2019 | 453,100 | — | 1,070,000 | 800,000 | 137,358 | (5) | 2,460,458 | |||||||||||||||||||||||||||||||||||||||
| Daniel B. Perry | 2021 | $ | 445,600 | $ | — | $ | 1,162,433 | $ | 1,050,000 | $ | 151,228 | (3) | $ | 2,809,261 | |||||||||||||||||||||||||||||||||
| Executive Vice President, | 2020 | 445,600 | — | 1,353,425 | 600,000 | 131,994 | (4) | 2,531,019 | |||||||||||||||||||||||||||||||||||||||
| Chief Financial Officer, | 2019 | 432,600 | — | 980,000 | 650,000 | 103,791 | (5) | 2,166,391 | |||||||||||||||||||||||||||||||||||||||
| Treasurer and Secretary | |||||||||||||||||||||||||||||||||||||||||||||||
| Kim K. Voss | 2021 | $ | 343,700 | $ | — | $ | 450,000 | $ | 475,000 | $ | 63,366 | (3) | $ | 1,332,066 | |||||||||||||||||||||||||||||||||
| Executive Vice President, | 2020 | 343,700 | — | 500,000 | 331,250 | 62,006 | (4) | 1,236,956 | |||||||||||||||||||||||||||||||||||||||
| Chief Accounting Officer, and | 2019 | 333,700 | — | 450,000 | 375,000 | 55,333 | (5) | 1,214,033 | |||||||||||||||||||||||||||||||||||||||
| Assistant Secretary | |||||||||||||||||||||||||||||||||||||||||||||||
| Non-Equity | ||||||||||||||||||||||||||||
| Name and Principal | Stock | Incentive Plan | All Other | |||||||||||||||||||||||||
| Position | Year | Salary | Bonus | Awards (1) | Compensation(2) | Compensation | Total | |||||||||||||||||||||
| William C. Bayless, Jr. | 2019 | $ | 800,000 | $ | — | $ | 3,230,000 | $ | 1,275,000 | $ | 497,845 | (3) | $ | 5,802,845 | ||||||||||||||
| Chief Executive | 2018 | $ | 790,500 | — | 2,325,000 | 1,100,000 | 457,498 | (4) | 4,672,998 | |||||||||||||||||||
| Executive Officer | 2017 | 775,000 | — | 3,300,000 | 875,000 | 435,684 | (5) | 5,385,684 | ||||||||||||||||||||
| James C. Hopke, Jr. | 2019 | $ | 475,000 | $ | — | $ | 1,260,000 | $ | 650,000 | $ | 140,271 | (3) | $ | 2,525,271 | ||||||||||||||
| President | 2018 | 463,500 | — | 850,000 | 550,000 | 113,136 | (4) | 1,976,636 | ||||||||||||||||||||
| 2017 | 450,000 | — | 1,000,000 | 450,000 | 92,724 | (5) | 1,992,724 | |||||||||||||||||||||
| William W. Talbot | 2019 | $ | 453,100 | $ | — | $ | 1,070,000 | $ | 800,000 | $ | 137,358 | (3) | $ | 2,460,458 | ||||||||||||||
| Executive Vice President, | 2018 | 394,000 | — | 765,000 | 625,000 | 120,217 | (4) | 1,904,217 | ||||||||||||||||||||
| Chief Investment Officer | 2017 | 382,500 | — | 1,000,000 | 450,000 | 107,007 | (5) | 1,939,507 | ||||||||||||||||||||
| Jennifer Beese | 2019 | $ | 432,600 | $ | — | $ | 980,000 | $ | 750,000 | $ | 96,994 | (3) | $ | 2,259,594 | ||||||||||||||
| Executive Vice President, | 2018 | 360,500 | — | 700,000 | 600,000 | 73,112 | (4) | 1,733,612 | ||||||||||||||||||||
| Chief Operating Officer | 2017 | 350,000 | — | 525,000 | 450,000 | 53,055 | (5) | 1,378,055 | ||||||||||||||||||||
| Daniel B. Perry | 2019 | $ | 432,600 | $ | — | $ | 980,000 | $ | 650,000 | $ | 103,791 | (3) | $ | 2,166,391 | ||||||||||||||
| Executive Vice President, | 2018 | 360,500 | — | 700,000 | 550,000 | 81,160 | (4) | 1,691,660 | ||||||||||||||||||||
| Chief Financial Officer, | 2017 | 350,000 | — | 525,000 | 450,000 | 62,990 | (5) | 1,387,990 | ||||||||||||||||||||
| Treasurer and Secretary | ||||||||||||||||||||||||||||
(1)The dollar amount recognized for the following awards of shares were valued at the aggregate grant date fair value of awards granted in accordance with ASC 718, Compensation-Stock Compensation. Assumptions used in the calculation of these amounts are included in note 11 to the Company’s audited financial statements for the year ended December 31, 2021, included in the annual report on Form 10-K for the year ended December 31, 2021. |
2017 (a) | 2018 (b) | 2019 (c) | 2019 (a) | 2020 (b) | 2021 (c) | |||||||||||||||||||||
| William C. Bayless, Jr. | 67,957 | 58,995 | 73,326 | William C. Bayless, Jr. | 73,326 | 96,148 | 81,928 | |||||||||||||||||||
| James C. Hopke, Jr. | 20,593 | 21,568 | 28,604 | |||||||||||||||||||||||
| Jennifer Beese | Jennifer Beese | 22,247 | 34,720 | 33,873 | ||||||||||||||||||||||
| William W. Talbot | 20,593 | 19,411 | 24,291 | William W. Talbot | 24,291 | 36,055 | 35,176 | |||||||||||||||||||
| Jennifer Beese | 10,811 | 17,762 | 22,247 | |||||||||||||||||||||||
| Daniel B. Perry | 10,811 | 17,762 | 22,247 | Daniel B. Perry | 22,247 | 28,711 | 28,010 | |||||||||||||||||||
| Kim K. Voss | Kim K. Voss | 10,216 | 10,607 | 10,843 | ||||||||||||||||||||||
(a)Includes the portion of annual bonus granted in RSAs and long-term incentive compensation as determined by the Compensation Committee in January 2019 based on achievement of goals determined in January 2018.
(b)Includes the portion of annual bonus granted in RSAs and long-term incentive compensation as determined by the Compensation Committee in January 2020 based on achievement of goals determined in January 2019.
(c)Includes the portion of annual bonus granted in RSAs and long-term incentive compensation as determined by the Compensation Committee in January 2021 based on achievement of goals determined in January 2020.
(2)Reflects the cash portion of annual bonuses per respective year as noted.
58
(3)Includes the following:
| Dividends on Common Units | Dividends on Unvested RSAs | 401(k) Matching Contributions | Other(a) | |||||||||||||||||||||||||||||
| William C. Bayless, Jr. | $ | 98,700 | $ | 484,808 | $ | 856 | $ | 10,274 | ||||||||||||||||||||||||
| Jennifer Beese | — | 167,481 | — | — | ||||||||||||||||||||||||||||
| William W. Talbot | 7,144 | 181,350 | 486 | — | ||||||||||||||||||||||||||||
| Daniel B. Perry | — | 146,971 | 4,257 | — | ||||||||||||||||||||||||||||
| Kim K. Voss | — | 63,008 | 358 | — | ||||||||||||||||||||||||||||
(a)Represents the value of the executive’s personal use of the Company’s airplane for one round-trip flight related to an urgent family matter. It is not the Company’s standard practice to allow personal use of the airplane.
(4)Includes the following:
| Dividends on Common Units | Dividends on Unvested RSAs | 401(k) Matching Contributions | ||||||||||||||||||||||||
| William C. Bayless, Jr. | $ | 98,700 | $ | 461,217 | $ | 4,875 | ||||||||||||||||||||
| Jennifer Beese | — | 137,637 | — | |||||||||||||||||||||||
| William W. Talbot | 7,144 | 158,211 | 4,778 | |||||||||||||||||||||||
| Daniel B. Perry | — | 127,119 | 4,875 | |||||||||||||||||||||||
| Kim K. Voss | — | 58,941 | 3,065 | |||||||||||||||||||||||
(5)Includes the following:
| Dividends on Common Units | Dividends on Unvested RSAs | 401(k) Matching Contributions | ||||||||||||||||||
| William C. Bayless, Jr. | $ | 98,175 | $ | 394,911 | $ | 4,759 | ||||||||||||||
| Jennifer Beese | — | 96,994 | — | |||||||||||||||||
| William W. Talbot | 7,106 | 125,502 | 4,750 | |||||||||||||||||
| Daniel B. Perry | — | 99,042 | 4,749 | |||||||||||||||||
| Kim K. Voss | — | 52,554 | 2,779 | |||||||||||||||||
(6)Represents prorated total base salary received in 2021, including increase in base salary upon Ms. Beese's promotion to President and Chief Operating Officer, effective August 24, 2021.
59
Dividends on Common Units | Dividends on Unvested RSAs | 401(k) Matching Contributions | ||||||||||
| William C. Bayless, Jr. | $ | 98,175 | $ | 394,911 | $ | 4,759 | ||||||
| James C. Hopke, Jr. | — | 136,004 | 4,267 | |||||||||
| William W. Talbot | 7,106 | 125,502 | 4,750 | |||||||||
| Jennifer Beese | — | 96,994 | — | |||||||||
| Daniel B. Perry | — | 99,042 | 4,749 | |||||||||
Dividends on Common Units | Dividends on Unvested RSAs | 401(k) Matching Contributions | ||||||||||
| William C. Bayless, Jr. | $ | 95,550 | $ | 357,323 | $ | 4,625 | ||||||
| James C. Hopke, Jr. | — | 108,980 | 4,156 | |||||||||
| William W. Talbot | 6,916 | 108,676 | 4,625 | |||||||||
| Jennifer Beese | — | 73,112 | — | |||||||||
| Daniel B. Perry | — | 76,535 | 4,625 | |||||||||
Dividends on Common Units | Dividends on Unvested RSAs | 401(k) Matching Contributions | ||||||||||
| William C. Bayless, Jr. | $ | 91,350 | $ | 339,834 | $ | 4,500 | ||||||
| James C. Hopke, Jr. | — | 88,641 | 4,083 | |||||||||
| William W. Talbot | 6,612 | 95,895 | 4,500 | |||||||||
| Jennifer Beese | — | 53,055 | — | |||||||||
| Daniel B. Perry | — | 58,490 | 4,500 | |||||||||
Grants of Plan Based Awards
The following table sets forth certain information with respect to RSAs granted during the year ended December 31, 2019,2021, for each Named Executive Officer with respect to annual bonus and long-term incentive compensation, all of which were granted under the 2010 Incentive Award Plan or the 2018 Incentive Award Plan. No options or other securities were granted during the year ended December 31, 2019.2021.
| All Other | Grant | |||||||||||||||||||||||||||||||||||||||||||||||||||||||
| Stock | Date Fair | |||||||||||||||||||||||||||||||||||||||||||||||||||||||
| Awards: | Value of | |||||||||||||||||||||||||||||||||||||||||||||||||||||||
| Estimated Future Payouts Under | Estimated Future Payouts Under | Number | Stock and | |||||||||||||||||||||||||||||||||||||||||||||||||||||
| Grant Date | Non-Equity Incentive Plan Awards | Equity Incentive Plan Awards | of | Option | ||||||||||||||||||||||||||||||||||||||||||||||||||||
| Name | Threshold | Target | Maximum | Threshold | Target | Maximum | Shares | Awards (3) | ||||||||||||||||||||||||||||||||||||||||||||||||
| William C. | 1/24/2022 | (1) | — | $ | 1,012,500 | $ | 2,025,000 | — | — | — | — | n/a | ||||||||||||||||||||||||||||||||||||||||||||
| Bayless, Jr. | 1/28/2021 | (2) | — | — | — | — | — | — | 81,928 | $ | 3,400,000 | |||||||||||||||||||||||||||||||||||||||||||||
| Jennifer | 1/24/2022 | (1) | — | $ | 637,500 | $ | 1,275,000 | — | — | — | — | n/a | ||||||||||||||||||||||||||||||||||||||||||||
| Beese | 1/28/2021 | (2) | — | — | — | — | — | — | 33,873 | $ | 1,405,733 | |||||||||||||||||||||||||||||||||||||||||||||
| William W. | 1/24/2022 | (1) | — | $ | 637,500 | $ | 1,275,000 | — | — | — | — | n/a | ||||||||||||||||||||||||||||||||||||||||||||
| Talbot | 1/28/2021 | (2) | — | — | — | — | — | — | 35,176 | $ | 1,459,800 | |||||||||||||||||||||||||||||||||||||||||||||
| Daniel B. | 1/24/2022 | (1) | — | $ | 525,000 | $ | 1,050,000 | — | — | — | — | n/a | ||||||||||||||||||||||||||||||||||||||||||||
| Perry | 1/28/2021 | (2) | — | — | — | — | — | — | 28,010 | $ | 1,162,433 | |||||||||||||||||||||||||||||||||||||||||||||
| Kim K. | 1/24/2022 | (1) | — | n/a | n/a | — | — | — | — | n/a | ||||||||||||||||||||||||||||||||||||||||||||||
| Voss | 1/28/2021 | (2) | — | — | — | — | — | — | 10,843 | $ | 450,000 | |||||||||||||||||||||||||||||||||||||||||||||
| All Other | Grant | ||||||||||||||||||||||||||||
| Stock | Date Fair | ||||||||||||||||||||||||||||
| Awards: | Value of | ||||||||||||||||||||||||||||
| Estimated Future Payouts Under | Estimated Future Payouts Under | Number | Stock and | ||||||||||||||||||||||||||
| Grant Date | Non-Equity Incentive Plan Awards | Equity Incentive Plan Awards | of | Option | |||||||||||||||||||||||||
| Name | Threshold | Target | Maximum | Threshold | Target | Maximum | Shares | Awards (3) | |||||||||||||||||||||
| William C. | 1/24/20 | (1) | — | $ | 700,000 | $ | 1,600,000 | — | — | — | — | n/a | |||||||||||||||||
| Bayless, Jr. | 1/24/19 | (2) | — | — | — | — | — | — | 73,326 | $ | 3,230,000 | ||||||||||||||||||
| James C. | 1/24/20 | (1) | — | $ | 415,625 | $ | 950,000 | — | — | — | — | n/a | |||||||||||||||||
| Hopke, Jr. | 1/24/19 | (2) | — | — | — | — | — | — | 28,604 | $ | 1,260,000 | ||||||||||||||||||
| William W. | 1/24/20 | (1) | — | $ | 396,463 | $ | 906,200 | — | — | — | — | n/a | |||||||||||||||||
| Talbot | 1/24/19 | (2) | — | — | — | — | — | — | 24,291 | $ | 1,070,000 | ||||||||||||||||||
| Jennifer | 1/24/20 | (1) | — | $ | 378,525 | $ | 865,200 | — | — | — | — | n/a | |||||||||||||||||
| Beese | 1/24/19 | (2) | — | — | — | — | — | — | 22,247 | $ | 980,000 | ||||||||||||||||||
| Daniel B. | 1/24/20 | (1) | — | $ | 378,525 | $ | 865,200 | — | — | — | — | n/a | |||||||||||||||||
| Perry | 1/24/19 | (2) | — | — | — | — | — | — | 22,247 | $ | 980,000 | ||||||||||||||||||
(2)RSAs granted in January 2021 for performance in 2020. Vest in five equal annual installments beginning on February 28 of the year following the year of grant.
(3)The base price is equal to the closing price of the Company’s common stock on the grant date.
Employment Contracts
As of December 31, 2019,2021, the Company had employment agreements in effect with each Named Executive Officer (Messrs. Bayless, Hopke, Talbot and Perry and Ms. Beese)Mses. Beese and Voss) providing that during the term of the respective agreement, the executive’s base salary will not be reduced and that the executive will remain eligible for participation in the executive compensation and benefit programs. The employment agreements in effect on December 31, 20192021 with the executive officers provided for Mr. Bayless to serve as a member of the Board and as Chief Executive Officer, Mr. Hopke to serve as President, Mr. Talbot to serve as Executive Vice President and Chief Investment Officer, Ms. Beese to serve as Executive Vice President and Chief Operating Officer, and Mr. Perry to serve as Executive Vice President and Chief Financial Officer and Ms. Voss to serve as Executive Vice President and Chief Accounting Officer.
The employment agreements provide for the following:
•Annual base salaries, subject in each case to increases in accordance with the Company’s normal executive compensation practices;
•Eligibility for annual cash bonus awards determined by the Compensation Committee or in the event that a formal annual bonus plan is in place for other senior executives, the bonus will be determined in accordance with the terms of the bonus plan on the same basis as other senior executives (with appropriate adjustments due to title and salary); and
60
•Participation in other employee benefit plans applicable generally to executives.
Additionally, the Company has entered into non-competition agreements with Messrs. Bayless, Hopke, Talbot and Perry and Ms.Mses. Beese and Voss in which the executive agreed to comply with all obligations under the non-competition agreement and further agreed that the non-competition agreement will survive any termination of the respective employment agreement or the executive’s employment, or subsequent service relationship with the Company, if any.
Outstanding Equity Awards at Fiscal Year-End
The following table sets forth certain information with respect to the market value as of December 31, 2019,2021, of all unvested RSAs held by each named executive officer as of December 31, 2019.2021.
| Stock Awards | ||||||||||||||
| Name | Number of Shares or Units of Stock That Have Not Vested (1) | Market Value of Shares or Units of Stock That Have Not Vested | ||||||||||||
| William C. Bayless, Jr. | 240,031 | $ | 13,751,376 | |||||||||||
| Jennifer Beese | 84,265 | $ | 4,827,542 | |||||||||||
| William W. Talbot | 90,478 | $ | 5,183,485 | |||||||||||
| Daniel B. Perry | 73,596 | $ | 4,216,315 | |||||||||||
| Kim K. Voss | 31,261 | $ | 1,790,943 | |||||||||||
| Stock Awards | |||||||
| Name | Number of Shares or Units of Stock That Have Not Vested (1) | Market Value of Shares or Units of Stock That Have Not Vested | |||||
| William C. Bayless, Jr. | 196,708 | $ | 9,251,177 | ||||
| James C. Hopke, Jr. | 68,649 | 3,228,562 | |||||
| William W. Talbot | 62,834 | 2,955,083 | |||||
| Jennifer Beese | 49,094 | 2,308,891 | |||||
| Daniel B. Perry | 50,026 | 2,352,723 | |||||
(1)Vest in five equal annual installments beginning on February 28 in the year following the year of grant.
Awards Vested
The following table sets forth certain information with respect to RSAs vested during 2019.2021.
| Stock Awards | ||||||
| Name | Number of Shares Acquired on Vesting | Value Realized on Vesting | ||||
| William C. Bayless, Jr. | 58,843 (1) | $ | 2,651,466 | |||
| James C. Hopke, Jr. | 16,589 (2) | 747,500 | ||||
| William W. Talbot | 17,395 (3) | 783,819 | ||||
| Jennifer Beese | 11,280 (4) | 508,277 | ||||
| Daniel B. Perry | 11,941 (5) | 538,107 | ||||
| Stock Awards | ||||||||||||||
| Name | Number of Shares Acquired on Vesting | Value Realized on Vesting | ||||||||||||
71,383 (1) | $ | 2,923,844 | ||||||
19,286 (2) | 789,944 | |||||||
23,941 (3) | 980,638 | |||||||||||||
18,325 (4) | 750,627 | |||||||||||||
| Kim K. Voss | 9,014 (5) | 369,234 | ||||||||||||
(2)Of these shares, 7,590 shares were withheld to satisfy related tax liabilities.
(3)Of these shares, 9,421 shares were withheld to satisfy related tax liabilities.
(4)Of these shares, 7,212 shares were withheld to satisfy related tax liabilities.
(5)Of these shares, 3,147 shares were withheld to satisfy related tax liabilities.
61
Potential Payments upon Termination or Change in Control
The following summarizes the compensation payable to each named executive officerNamed Executive Officer under the applicable employment agreement in the event of a termination of such executive’s employment.
Each employment agreement provides that the respective executive may terminate the agreement at any time by delivering written notice of termination to us at least 30 days prior to the effective date of such termination, in which case the executive will be entitled to payment of base salary through the effective date of termination, plus all other benefits to which the executive has a vested right at that time.
Additionally, each employment agreement provides that the executive may terminate the agreement for “good reason,” which is defined in the employment agreement, in general, as any substantial change by the Company in the nature of the executive’s employment without their express written consent; the requirement that the executive be based at a location at least 50 miles further than from his current principal location of employment; the Company’s failure to obtain a satisfactory agreement from any successor to assume the terms of the employment agreement; and the Company’s breach of any material provision of the employment agreement.
The employment agreements provide that, if the Company terminates an executive’s employment without “cause” or the executive terminates employment for “good reason” (each as defined in the applicable employment agreement), the executive will be entitled to the following payments and benefits, subject to execution and non-revocation of a general release of claims:
•A cash payment equal to 299% for Mr. Bayless and 100% for Messrs. Hopke, Talbot and Perry and Ms.Mses. Beese and Voss, in each case times the sum of his or her then-current annual base salary plus the average annual cash bonus paid or payable in respect of the three years immediately prior to the year of termination;
•A prorated cash bonus for the year in which the termination occurs equal to the greater of (i) the annual cash bonus paid or payable in respect to the year immediately prior to the year in which the termination occurs or (ii) the target cash bonus for the year in which the termination occurs;
•Health benefits for two years following the executive’s termination of employment at the same cost to the executive as in effect immediately preceding such termination, subject to reduction to the extent that the executive receives comparable benefits from a subsequent employer;
•All of the executive’s RSAs vest; and
•Excise tax equalization payments for Messrs. Bayless and Hopke.Mr. Bayless.
62
The amounts set forth in the table below represent the compensation payable to each named executive officer under the respective employment agreement in the event of a termination of such executive’s employment. The amounts shown assume such termination was effective as of December 31, 2019,2021, and therefore include amounts earned through such time and are estimates of the amounts that would be paid to the executives upon their termination. The actual amounts to be paid can only be determined at the time of such executive’s termination.
| Name | Benefit | Without Cause or For Good Reason | ||||
| William C. Bayless, Jr. | Severance payment | $ | 3,475,333 | |||
| RSA vesting | 9,251,177 | |||||
| Bonus | 1,275,000 | |||||
| Health benefits | 26,294 | |||||
| Excise tax equalization payments | — | |||||
| $ | 14,027,804 | |||||
| James C. Hopke, Jr. | Severance payment | $ | 1,025,000 | |||
| RSA vesting | 3,228,562 | |||||
| Bonus | 650,000 | |||||
| Health benefits | 38,396 | |||||
| Excise tax equalization payments | — | |||||
| $ | 4,941,958 | |||||
| William W. Talbot | Severance payment | $ | 1,078,100 | |||
| RSA vesting | 2,955,083 | |||||
| Bonus | 800,000 | |||||
| Health benefits | 38,396 | |||||
| Excise tax equalization payments | — | |||||
| $ | 4,871,579 | |||||
| Jennifer Beese | Severance payment | $ | 1,032,600 | |||
| RSA vesting | 2,308,891 | |||||
| Bonus | 750,000 | |||||
| Health benefits | 24,615 | |||||
| Excise tax equalization payments | — | |||||
| $ | 4,116,106 | |||||
| Daniel B. Perry | Severance payment | $ | 982,600 | |||
| RSA vesting | 2,352,723 | |||||
| Bonus | 650,000 | |||||
| Health benefits | 38,396 | |||||
| Excise tax equalization payments | — | |||||
| $ | 4,023,719 | |||||
| Name | Benefit | Without Cause or For Good Reason | |||||||||||||||
| William C. Bayless, Jr. | Severance payment | $ | 5,777,926 | ||||||||||||||
| RSA vesting | 13,751,376 | ||||||||||||||||
| Bonus | 1,350,000 | ||||||||||||||||
| Health benefits | 17,176 | ||||||||||||||||
| Excise tax equalization payments | — | ||||||||||||||||
| $ | 20,896,478 | ||||||||||||||||
| Jennifer Beese | Severance payment | $ | 1,200,000 | ||||||||||||||
| RSA vesting | 4,827,542 | ||||||||||||||||
| Bonus | 850,000 | ||||||||||||||||
| Health benefits | 15,893 | ||||||||||||||||
| Excise tax equalization payments | — | ||||||||||||||||
| $ | 6,893,435 | ||||||||||||||||
| William W. Talbot | Severance payment | $ | 1,141,700 | ||||||||||||||
| RSA vesting | 5,183,485 | ||||||||||||||||
| Bonus | 850,000 | ||||||||||||||||
| Health benefits | 24,406 | ||||||||||||||||
| Excise tax equalization payments | — | ||||||||||||||||
| $ | 7,199,591 | ||||||||||||||||
| Daniel B. Perry | Severance payment | $ | 1,045,600 | ||||||||||||||
| RSA vesting | 4,216,315 | ||||||||||||||||
| Bonus | 700,000 | ||||||||||||||||
| Health benefits | 24,406 | ||||||||||||||||
| Excise tax equalization payments | — | ||||||||||||||||
| $ | 5,986,321 | ||||||||||||||||
| Kim K. Voss | Severance payment | $ | 695,783 | ||||||||||||||
| RSA vesting | 1,790,943 | ||||||||||||||||
| Bonus | 331,250 | ||||||||||||||||
| Health benefits | 24,406 | ||||||||||||||||
| Excise tax equalization payments | — | ||||||||||||||||
| $ | 2,842,382 | ||||||||||||||||
63
Pursuant to the employment agreements with Messrs. Bayless, Hopke, Talbot and Perry and Ms.Mses. Beese and Voss, if an executive’s employment is terminated without cause or the executive terminates employment for good reason, retirement, death or disability, all of the executive’s RSAs will vest. “Disability” is defined as any physical or mental disability or infirmity that prevents the performance of the executive’s duties for a period of (i) six consecutive months or (ii) an aggregate of 12 months in any 24 consecutive month period. Any question as to the existence, extent or potentiality of an executive’s disability upon which the Company and the executive cannot agree will be determined by a qualified, independent physician selected by us and approved by the executive (which approval will not be unreasonably withheld), with the determination of any such physician being final and conclusive. “Retirement” is defined as a termination of employment other than for cause, disability or death, following the date on which the sum of the following equals or exceeds 70 years: (i) the number of full years of the executive’s employment and other business relationships with the Company or its predecessors and (ii) the executive’s age on the date of termination; provided that (x) the executive’s employment by (or other business relationships with) the Company and any of its predecessors have continued for a period of at least 120 contiguous full months at the time of termination and, on the date of termination, the executive is at least 50 years old; (y) the executive gives at least six months’ prior written notice to the Company of his or her intention to retire; and (z) the noncompetition agreement remains in full force and effect and the executive enters into a general release of all claims in a form that is reasonably satisfactory to the Company. Under this formula, Messrs.Mr. Bayless and Hopke became eligible for retirement in 2014, and 2016, respectively, and Messrs. Talbot and Perry and Ms. Beese will become eligible for retirement in 2024.2023, Messrs. Talbot and Perry will become eligible for retirement in 2024, and Ms. Voss will become eligible for retirement in 2025.
The values of the RSAs for which vesting would accelerate for such a termination as of December 31, 2019,2021, based on a closing price of $47.03$57.29 on December 31, 2019,2021, are as follows: Mr. Bayless-$9,251,177, Mr. Hopke-13,751,376, Ms. Beese-$3,228,562,4,827,542, Mr. Talbot-$2,955,083,5,183,485, Mr. Perry-$2,352,7234,216,315 and Ms. Beese-$2,308,891.Voss -$1,790,943.
Nonqualified Deferred Compensation
Effective January 1, 2015, the Compensation Committee established a deferred compensation plan for the benefit of senior officers, directors and other key employees in which the participant may elect to defer cash compensation and/or vested equity awards granted under the Company’s share incentive plans. A participant has a fully vested right to his or her cash deferral amounts and the vested deferred share awards.
The following table provides certain information regarding contributions to, withdrawals from and earnings in the deferred compensation plan as of and for the year ended December 31, 2019:2021:
Executive Contributions in Last Fiscal Year (1) | Aggregate Earnings in Last Fiscal Year (2) | Aggregate Withdrawals/ Distributions | Aggregate Balance at Last Fiscal Year-End | |||||||||||||||||||||||
| William C. Bayless, Jr. | $ | — | $ | — | $ | — | $ | — | ||||||||||||||||||
| Jennifer Beese | — | — | — | — | ||||||||||||||||||||||
| William W. Talbot | 23,335 | 43,159 | — | 252,868 | ||||||||||||||||||||||
| Daniel B. Perry | — | 2,797 | — | 22,944 | ||||||||||||||||||||||
| Kim K. Voss | 43,254 | 60,038 | — | 229,324 | ||||||||||||||||||||||
(1) Credited to the participant’s account is an amount equal to the amount designated as the participant’s deferral for the plan year as indicated in the participant’s deferral election. Amounts reported in this column represent compensation they elected to defer, which amounts are included in various compensation columns of the Summary Compensation Table.
(2) Aggregate earnings in 2021 represent the income and net unrealized gain or loss reported by the trustee of the deferred compensation plan. Earnings on the deferred compensation plan do not include contributions by the Company or the Named Executive Officer, were at market rates available to other investors, and are not included in the Summary Compensation Table.
64
Executive Contributions in Last Fiscal Year (1) | Aggregate Earnings in Last Fiscal Year (2) | Aggregate Withdrawals/ Distributions | Aggregate Balance at Last Fiscal Year-End | |||||||||||||
| William C. Bayless, Jr. | $ | — | $ | — | $ | — | $ | — | ||||||||
| James C. Hopke, Jr. | 175,779 | 62,113 | — | 502,587 | ||||||||||||
| William W. Talbot | 22,655 | 28,754 | — | 137,418 | ||||||||||||
| Jennifer Beese | — | — | ||||||||||||||
| Daniel B. Perry | 4,222 | — | 15,264 | |||||||||||||
Equity Compensation Plan
The following table summarizes information, as of December 31, 2019,2021, relating to the Company’s equity compensation plans pursuant to which grants of options, RSAs and other rights to acquire common stock may be granted from time to time.
| Plan category | Number of securities to be issued upon exercise of outstanding options, warrants and rights (a) | Weighted-average exercise price of outstanding options, warrants and rights (b) | Number of securities remaining available for future issuance under equity compensation plans (excluding securities reflected in column (a)) (c) | |||||||||||||||||
| Equity compensation plans approved by security holders | n/a | |||||||||||||||||||
| Equity compensation plans not approved by security holders | n/a | n/a | n/a | |||||||||||||||||
(1)Consists of RSAs granted to executive officers and certain employees and common units of limited partnership interest in the Company’s operating partnership.
CEO Compensation Pay Ratio
For 2019,2021, the total compensation of the Company’s CEO as reported in the Summary Compensation Table was $5,802,845$6,776,638 and total compensation for the median employee was $26,519.$32,817. The resulting ratio of the CEO’s pay to the pay of the median employee for the year ended December 31, 20192021 was 219206 to 1. The CEO to median pay ratio is calculated in accordance with SEC requirements pursuant to Item 402(u) of Regulation S-K. The Company calculated annual total compensation for the median employee using the same methodology it uses for its named executive officers as set forth in the Summary Compensation Table. No significant changes occurred in our employee population since our originalmost recent median employee identification which took place in 2017;2021; as such, the Company has not re-identified the median employee since 2017.2021. However, because the median employee used for purposes of calculating the pay ratio for 2018 iswas no longer employed by the Company as of December 31, 2019, the Company2021, we identified a substitute median employee whose compensation and job duties are substantially similar to the prior year median employee for purposes of calculating the pay ratio for 2019. 2022.
Please keep in mind that under the SEC’s rules and guidance, there are numerous ways to determine the compensation of a company’s median employee, including the employee population sampled, the elements of pay and benefits used, any assumptions made and the use of statistical sampling. In addition, no two companies have identical employee populations or compensation programs. As such, the Company’s pay ratio may not be comparable to the pay ratio reported by other companies.
65
CERTAIN RELATIONSHIPS AND RELATED TRANSACTIONS
The Company is not a party to any transaction with executive officers or directors that is required to be disclosed under Item 404(a) of Regulation S-K.
66
QUESTIONS AND ANSWERS
Q: What am I voting on?
A: Election of ten directors to hold office for a one-year term, ratification of Ernst & Young LLP as the Company’s independent auditors for 2022 and approval of an advisory vote on executive compensation.
Q: Who is entitled to vote?
A: Shareholders as of the close of business on [ ], 2022 are entitled to vote at the Annual Meeting. Each share of common stock is entitled to one vote.
Q: How do I vote?
A: Sign and date each WHITE proxy card you receive and return it in the prepaid envelope. If you do not mark any selections, the proxy holders named on your proxy card will vote your shares in favor of all of the director nominees, in favor of the ratification of Ernst & Young LLP as the Company’s independent auditors for 2022 and in favor of approval, on an advisory basis, of the compensation of the named executive officers. You may change your vote or revoke your proxy at any time before the Annual Meeting by submitting written notice to the Secretary, submitting another proxy that is properly signed and later dated or voting in person at the Annual Meeting. In each case, the later submitted votes will be recorded and the earlier votes revoked.
As summarized below, there are distinctions between shares held of record and those owned beneficially:
Shareholder of Record—If your shares are registered directly in your name, you are considered the shareholder of record of those shares. As the shareholder of record, you can submit your voting instructions by Internet, telephone or mail as described on the enclosed WHITE proxy card.
Beneficial Owner—If your shares of common stock are held through a broker or bank in “street name” as of the close of business on the record date, deliver the enclosed WHITE voting instruction form in the pre-addressed postage-paid envelope provided to vote your common stock or contact the person responsible for your account to vote on your behalf and ensure that a WHITE voting instruction form is submitted on your behalf. In most instances, you will be able to do this over the Internet, by telephone or by mail as indicated on your WHITE voting instruction form. It is critical that you promptly give instructions to your brokerage firm, bank or other nominee to vote “FOR” the election of all nominees proposed by the Board of Directors on the WHITE voting instruction form, You may vote your shares in person at the meeting only if you obtain a legal proxy from your brokerage firm, bank or other nominee.
Please note that Land & Buildings Capital Growth Fund, LP, a fund managed by Land & Buildings Investment Management, LLC (“Land & Buildings”), has notified us that it intends to nominate one of Land & Buildings’ employees for election to our Board of Directors at the Annual Meeting. You may receive solicitation materials from Land & Buildings, including a proxy statement and [COLOR] proxy card. We are not responsible for the accuracy of any information provided by or relating to Land & Buildings or its nominees contained in solicitation materials filed or disseminated by or on behalf of Land & Buildings or any other statements Land & Buildings may make.
Our Board of Directors does not endorse the Land & Buildings nominee and unanimously recommends that you vote “FOR” the election of all nominees proposed by the Board of Directors on the WHITE proxy card (including via the telephone or Internet methods of voting specified on the card). Our Board of Directors strongly urges you not to return or vote any [COLOR] proxy card sent to you by Land & Buildings. Please note that voting to “withhold” with respect to the Land & Buildings nominee on a [COLOR] proxy card sent to you by Land & Buildings is not the same as voting “for” the Board of Directors’ nominees, because a vote to “withhold” with respect to the Land & Buildings nominee on its [COLOR] proxy card will revoke any WHITE proxy you may have previously submitted.
67
To support the Company's Board of Directors’ nominees, you should vote FOR the Board’s nominees on the WHITE proxy card and disregard, and not return, any [COLOR] proxy card sent to you by Land & Buildings. If you have previously submitted a [COLOR] proxy card sent to you by Land & Buildings, you can revoke that proxy and vote for our Board of Directors’ nominees by using the enclosed WHITE proxy card (including via the telephone or Internet methods of voting specified thereon) which will automatically revoke your prior proxy. Any later-dated [COLOR] proxy card that you send to Land & Buildings will also revoke your proxy, including WHITE proxies that you have voted FOR our Board of Directors’ nominees, and we strongly urge you not to sign or return any [COLOR] proxy cards sent to you by Land & Buildings. Only the latest dated validly executed proxy that you submit will be counted.
If you require assistance in changing, revoking or voting your proxy, please contact the company’s proxy solicitor:

1407 Broadway, 27th Floor
New York, New York 10018
(212) 929-5500 (Call Collect)
or
Call Toll-Free (800) 322-2885
Email: proxy@mackenziepartners.com
Under New York Stock Exchange rules, the proposal to ratify the appointment of independent registered public accountants is considered a “discretionary” item. This means that brokerage firms may vote in their discretion on this matter on behalf of clients who have not furnished voting instructions at least ten days before the date of the meeting.
In their discretion, the proxy holders are authorized to vote on any other matters that may properly come before the Annual Meeting and at any postponement or adjournment thereof. The Board knows of no other items of business that will be presented for consideration at the Annual Meeting other than the proposals described in this Proxy Statement.
Q: Is my vote confidential?
A: Yes. Proxy cards, ballots and voting tabulations that identify individual shareholders are confidential. Only the inspectors of election and certain employees associated with processing proxy cards and counting the vote have access to your card. Additionally, all comments directed to management (whether written on the proxy card or elsewhere) will remain confidential, unless you ask that your name be disclosed.
Q: Who will count the vote and how are votes counted?
A: All votes will be tabulated by a representative of [ ], as the independent inspector of election appointed for the Annual Meeting, who will separately tabulate affirmative and negative votes and withheld votes and abstentions. In order to be elected as a director, because of the contested nature of the election of directors, under our Bylaws, a nominee must receive a plurality of the votes cast at the Annual Meeting at which a quorum is present, which means the 10 nominees who receive the largest number of properly cast votes will be elected as directors. For election of directors, abstentions and broker non-votes will not affect the vote outcome. In order for Ernst & Young LLP to be ratified as the Company’s independent auditors for 2022 and for the advisory vote on executive compensation to be approved, the respective proposal must receive a majority of the votes cast at the Annual Meeting at which a quorum is present. For ratification of the independent auditors for 2022, an abstention will have the same effect as an “Against” vote. Because of the contested nature of the election of directors, under NYSE rules, if you are the beneficial owner of shares rather than the shareholder of record and receive proxy materials from Land & Buildings, your broker will not have the authority to exercise discretion to vote such shares with respect to proposal 2 unless they receive your instructions. If you do not receive proxy materials from
68
Land & Buildings, your broker or nominee will have the authority to exercise discretion to vote such shares with respect to Proposal 2 because the matter is treated as routine under the NYSE rules. For approval of the advisory vote on executive compensation, an abstention will have the same effect as an “Against” vote, but a broker non-vote will not affect the vote outcome. “Broker non-votes” are proxies from brokers or other nominees indicating that such person has not received instructions from the beneficial owner or other person entitled to vote the shares that are the subject of the proxy on a particular matter with respect to which the broker or other nominee does not have discretionary voting power.
Q: What constitutes a quorum?
A: As of the record date for the Annual Meeting, [ ] shares of common stock were issued and outstanding, as well as [ ] unvested restricted stock awards entitled to be voted by employees. A majority of the outstanding shares, present or represented by proxy, constitutes a quorum for the transaction of business at the Annual Meeting. Abstentions and broker non-votes will be counted in determining the presence of a quorum.
Q: Who can attend the Annual Meeting?
A: All shareholders of record as of [ ], 2022 can attend.
Q: Who pays for this proxy solicitation?
A: The Company will bear the entire cost of solicitation of proxies, including preparation, assembly and mailing of this Proxy Statement, the proxy card and any additional information furnished to shareholders. Copies of solicitation materials will be furnished to banks, brokerage houses, fiduciaries and custodians holding shares of the Company’s common stock in their names that are beneficially owned by others to forward to these beneficial owners. Persons representing beneficial owners may be reimbursed for their costs of forwarding the solicitation material to such beneficial owners. Original solicitation of proxies by mail may be supplemented by telephone, facsimile, electronic mail or personal solicitation by the Company’s directors, officers or employees. The Company will not pay any additional compensation to directors, officers or employees for such services. The Company has retained MacKenzie Partners, Inc.to solicit proxies. Under our agreement MacKenzie Partners, Inc., will receive a fee of approximately $[ ] plus reasonable out-of-pocket expenses. MacKenzie Partners, Inc. expects that approximately 25 of its employees will assist in the solicitation of proxies. In addition, MacKenzie Partners, Inc. and certain related persons will be indemnified against certain liabilities arising out of or in connection with the engagement.
We estimate that our additional out-of-pocket expenses beyond those normally associated with soliciting proxies for an annual meeting of shareholders and incurred in connection with preparing for a potential contested solicitation of proxies will be $[ ] in the aggregate, of which approximately $[ ] has been spent to date. Such additional solicitation costs are expected to include the fees incurred to retain MacKenzie Partners, Inc. as the Company’s proxy solicitor, as discussed above, fees of outside legal and public relations advisors, investment bankers and other consultants to advise the company in connection with a possible contested solicitation of proxies, increased mailing costs, such as the costs of additional mailings of solicitation materials to shareholders, including printing costs, mailing costs and the reimbursement of reasonable expenses of banks, brokerage houses and other agents incurred in forwarding solicitation materials to beneficial owners, as described above, and the costs of retaining an independent inspector of election.
Additional information about persons who are participants in this proxy solicitation is set forth in Appendix A.
69
PROPOSAL 1 –
ELECTION OF DIRECTORS
| The Board recommends you vote FOR each of the nominees listed. | ||
ELECTION OF DIRECTORS
There are currently nine10 directors on the Board, William C. Bayless, Jr., Herman E. Bulls, G. Steven Dawson, Cydney C. Donnell, Mary C. Egan, Edward Lowenthal,Alison M. Hill, Craig A. Leupold, Oliver Luck, C. Patrick Oles, Jr., and John T. Rippel, and Carla Piñeyro Sublett, each of whom has been nominated for re-election to the Board. The employment agreement with Mr. Bayless provides that he will be nominated as a director. See “Executive Compensation – Employment Contracts” for additional information. The Board of Directors elected at the Annual Meeting will hold office for a one-year term.
All nominees have consented to serve as directors. The Board has no reason to believe that any of the nominees will be unable to act as director. However, if a director is unable to stand for re-election, the Board may either reduce the size of the Board or the Nominating and Corporate Governance Committee may designate a substitute. If a substitute nominee is named, the proxies will vote for the election of the substitute.
Because of the contested nature of this election of directors, under our Bylaws, directors are elected by a majorityplurality of the votes cast at the Annual Meeting.Meeting, which means the 10 nominees who receive the largest number of properly cast votes will be elected as directors. Each share of common stock is entitled to one vote for each of the nineten director nominees. Cumulative voting is not permitted.
Consideration of Director Nominees
The Nominating and Corporate Governance Committee will consider appropriate nominees for director whose names are submitted in writing by a holder of the Company’s common stock. Nominations must be addressed to ChairmanChair of the Nominating and Corporate Governance Committee, c/o American Campus Communities, Inc., 12700 Hill Country Blvd., Suite T-200, Austin, Texas 78738, indicating the nominee’s qualification and other relevant biographical information and providing confirmation of the nominee’s consent to serve as director. In order to be considered for the next annual election of directors, any such written request must comply with the requirements set forth in the Company’s bylaws.
The ChairmanChair of the Board, or the Chief Executive Officer or the Board of Directors may call a special meeting of the stockholders.shareholders. A special meeting of stockholdersshareholders will be called upon the written request of the stockholdersshareholders entitled to cast not less than a majority of all the votes entitled to be cast at such meeting, provided that such written request complies with the requirements set forth in the Company’s bylaws.
The committee considers nominees for the Board from any reasonable source, including current Board members, stockholdersshareholders or other persons.
Each of the current directors has been nominated for election as director at the 20202022 Annual Meeting.
70
PROPOSAL 2 –
RATIFICATION OF THE SELECTION OF THE INDEPENDENT AUDITORS
| The Audit Committee, which has the sole authority to retain the Company's independent auditors, recommends that you vote FOR the ratification of the appointment of Ernst & Young LLP as the Company's independent auditors for | ||
Ratification of the Selection of the Independent Auditors
The Audit Committee has reappointed Ernst & Young LLP as the Company’s independent auditors for 2020.2022. The Board recommends that shareholders ratify the Company’s selection of Ernst & Young as our independent auditor. Representatives of Ernst & Young will be at the Annual Meeting, will have an opportunity to make a statement if they so desire, and will be available to respond to appropriate questions.
The proposal will be approved if it receives the affirmative vote of a majority of shares represented in person or by proxy at the Annual Meeting.
AUDIT COMMITTEE INFORMATION
Report of the Audit Committee
The Audit Committee, on behalf of the Board of Directors, serves as an independent and objective party to monitor the Company’s financial reporting process and internal control system, and is directly responsible for the appointment, compensation and oversight of our independent registered public accounting firm. The Audit Committee also evaluates, on an annual basis, whether it is in the best interests of shareholders to reengage Ernst & Young as the Company’s independent auditors, and is involved in the selection of the engagement partner in accordance with the mandated Public Company Accounting Oversight Board (“PCAOB”) partner rotation rules. The Audit Committee performs these oversight responsibilities in accordance with its Audit Committee Charter, which is available on the investor relations section of the Company’s website at www.AmericanCampus.com.
Management has the responsibility for the financial statements and the reporting process, including the systems of internal controls. In fulfilling its oversight responsibilities, the Audit Committee reviewed with management the audited financial statements in the Company’s Annual Report, and discussed with management the quality, not just the acceptability, of the accounting principles, the reasonableness of significant judgments and the clarity of disclosures in the financial statements. The Audit Committee also reviewed and discussed the Company’s earnings releases with management.
During 2019,2021, the Audit Committee met with management and the Company’s independent auditors and internal auditor periodically to consider the adequacy of the Company’s internal controls and the objectivity of the Company’s financial reporting in response to the requirements set forth in Section 404 of the Sarbanes-Oxley Act and related regulations. The Audit Committee also discussed with management and the Company’s independent auditors and internal auditor the process used for certifications by the Company’s Chief Executive Officer and Chief Financial Officer that are required for certain of the Company’s filings with the Securities and Exchange Commission.
Ernst & Young LLP, the Company’s independent auditors, is responsible for auditing the Company’s financial statements and for expressing an opinion on the conformity of those audited financial statements with generally accepted accounting
principles. The Audit Committee
71
reviewed and discussed with the independent auditors their judgments as to the quality, not just the acceptability, of the Company’s accounting principles and such other matters as are required to be discussed with the Audit Committee under Statement on Auditing Standards No. 61, as amended, as adopted by the PCAOB in Rule 3200T. Additionally, the Audit Committee discussed with the independent auditors the inclusion of Critical Audit Matters in the opinion accompanying the audited financial statements. The Audit Committee also received the written disclosures and the letter from the independent auditors required by the applicable requirements of the PCAOB regarding the independent auditor’s communications with the Audit Committee concerning independence. The Audit Committee has discussed with the independent auditors the auditors’ independence from management and us and considered the compatibility of non-audit services with the auditors’ independence.
The Audit Committee discussed with the independent auditors the overall scope and plans for their audit. The Audit Committee meets at least quarterly with the independent auditors, with and without management present, to discuss the results of their examinations, their evaluations of the Company’s internal controls, and the overall quality of the Company’s financial reporting. The Audit Committee also meets with management and the independent auditors prior to the filing of the quarterly reports on Form 10-Q with the SEC and release to the public of its quarterly and year-end financial results to, among other things, review and discuss such filings, review any related financial statements and related variances, review significant accounting policies and discuss any significant accounting treatments applied during the period.
In evaluating the appropriateness of engaging Ernst & Young as the Company’s independent auditors, the Audit Committee considers a number of factors including, but not limited to: (i) Ernst & Young’s relevant technical expertise and its significant institutional knowledge of the Company’s operations and industry; (ii) the quality and candor of Ernst & Young’s communications with the Audit Committee and management; (iii) Ernst & Young’s independence, including the consideration of any non-audit services provided by Ernst & Young and their impact on independence; (iv) the quality and efficiency of the services provided by Ernst & Young, including input from management on Ernst & Young’s performance, objectivity and professional skepticism; (v) external data on audit quality and performance, including recent PCAOB reports on Ernst & Young and its peer firms; (vi) the appropriateness of Ernst & Young’s fees; and (vii) Ernst & Young’s tenure as independent auditors, including the benefits of a longer tenure, and the controls and processes in place that help ensure Ernst & Young’s continued independence. Ernst & Young has served as the Company’s independent auditors since 2004. Based on this evaluation, the Audit Committee and the Board believe that retaining Ernst & Young to serve as independent auditors for 20202022 is in the best interests of the Company and its shareholders.
In reliance on the reviews and discussions referred to above, the Audit Committee recommended to the Board of Directors (and the Board has approved) that the audited financial statements be included in the Company’s Annual Report on Form 10-K for the year ended December 31, 20192021 for filing with the SEC.
This section of the proxy statement is not deemed “filed” with the SEC and is not incorporated by reference into the Company’s Annual Report on Form 10-K.
This Audit Committee report is given by the following members of the Audit Committee as of December 31, 2019:2021:
G. Steven Dawson, ChairmanChair
C. Patrick Oles, Jr.
John T. Rippel
72
Independent Auditor Fees
The following summarizes the approximate aggregate fees billed to American Campus Communities for the fiscal years ended December 31, 20192021 and 20182020 by the Company’s principal accounting firm, Ernst & Young LLP:
| Total Approximate Fees | ||||||||||||||
Types of Services (1) | 2021 | 2020 | ||||||||||||
Audit Fees (2) | $ | 2,340,000 | $ | 2,060,000 | ||||||||||
| Audit-Related Fees | — | — | ||||||||||||
| Tax Fees | — | — | ||||||||||||
All Other Fees (3) | 7,200 | 7,200 | ||||||||||||
| Total | $ | 2,347,200 | $ | 2,067,200 | ||||||||||
(2)Fees for audit services billed in 2021 and 2020 included the following: (i) audit of the Company’s annual financial statements; (ii) reviews of quarterly financial statements; (iii) audit of internal control over financial reporting; and (iv) services related to SEC matters, including issuances of comfort letters, consents and other services.
(3)All other fees include the aggregate fees for products and services provided by Ernst & Young LLP that are not reported under “Audit Fees,” “Audit-Related Fees” or “Tax Fees.”
| Total Approximate Fees | ||||||||
Types of Services (1) | 2019 | 2018 | ||||||
Audit Fees (2) | $ | 1,640,000 | $ | 1,572,500 | ||||
| Audit-Related Fees | — | — | ||||||
| Tax Fees | — | — | ||||||
All Other Fees (3) | 3,620 | 2,160 | ||||||
| Total | $ | 1,643,620 | $ | 1,574,660 | ||||
The Audit Committee has developed policies and procedures concerning its pre-approval of audit and non-audit services provided to us by the independent auditors. These provide that the Audit Committee must pre-approve all audit and permitted non-audit services (including the fees and terms thereof) to be rendered to the Company by the independent auditors. The independent auditors provide the Audit Committee with a list describing the services expected to be performed by the independent auditor. Any request for services not contemplated by this list must be submitted to the Audit Committee for specific pre-approval and the provision of such services cannot commence until such approval has been granted. Normally, pre-approval is provided at regularly scheduled meetings. However, the Audit Committee has authorized the committee’s ChairmanChair to approve the provision by the Company’s independent auditors of up to $50,000 per occurrence of non-audit services not prohibited by law. Each decision made by the Audit Committee ChairmanChair will be reported to the full Audit Committee at its next meeting.
In addition, although not required by the rules and regulations of the SEC, the Audit Committee generally requests a range of fees associated with each proposed service. The Audit Committee believes that providing a range of fees for a service incorporates appropriate oversight and control of the independent auditor relationship, while permitting us to receive immediate assistance from the independent auditor when time is of the essence.
In considering the nature of the services provided by Ernst & Young LLP, the Audit Committee determined that such services are compatible with the provision of independent audit services. The Audit Committee discussed these services with representatives of Ernst & Young LLP and management to determine that they are permitted under the rules and regulations concerning auditor independence promulgated by the SEC to implement the Sarbanes-Oxley Act of 2002, as well as by the American Institute of Certified Public Accountants.
73
PROPOSAL 3 –
ADVISORY VOTE ON EXECUTIVE COMPENSATION
| The Board recommends that you vote FOR approval of the advisory vote on executive compensation. | ||
ADVISORY VOTE ON EXECUTIVE COMPENSATION
The Dodd-Frank Act enables the Company’s stockholdersshareholders to vote to approve, on an advisory (nonbinding) basis, the compensation of the Company’s named executive officers as disclosed in this proxy statement in accordance with the SEC’s rules.
As described in detail under the heading “Executive Compensation – Compensation Discussion and Analysis,” these executive compensation programs are designed to attract, motivate and retain executives who have the motivation, experience and skills necessary to lead the Company effectively. Under these programs, named executive officers are rewarded for the achievement of specific performance measures that are directly related to financial performance goals and creation of stockholdershareholder value. Please read the “Compensation Discussion and Analysis” for additional details about the Company’s executive compensation programs, including information about the 20192021 compensation of the named executive officers.
Shareholders approved the Company’s executive compensation at the 20192021 Annual Meeting of Stockholders.Shareholders. The Compensation Committee continually reviews the compensation programs for the named executive officers to ensure they achieve the desired goals of aligning executive compensation structure with stockholders’shareholders’ interests and current market practices. As a result of its review process, the Compensation Committee:
•Provides a significant portion of each executive’s compensation as variable compensation in a pay-for-performance setting through a combination of cash bonuses and equity-based grants;
•Provides a significant portion of total compensation as non-cash compensation in the form of long-term equity-based awards to more closely align the interests of executives with those of stockholdersshareholders and to maximize retention insofar as all equity-based awards are subject to time-based vesting; and
•Uses long-term compensation, payment of annual bonuses in part in shares, clawbacks, and a variety of performance metrics to closely tie executives’ wealth to the Company’s long-term health.
The Company is asking stockholdersshareholders to indicate their support for named executive officer compensation as described in this proxy statement. This proposal, commonly known as a “say-on-pay” proposal, gives stockholdersshareholders the opportunity to express their views on named executive officers’ compensation. This vote is not intended to address any specific item of compensation, but rather the overall compensation of the named executive officers and the philosophy, policies and practices described in this proxy statement. Accordingly, the Board will ask stockholdersshareholders to vote “FOR” the following resolution at the annual meeting:
“RESOLVED, that the Company’s stockholdersshareholders approve, on an advisory basis, the compensation of the named executive officers, as disclosed in the Company’s Proxy Statement for the 20202022 Annual Meeting of StockholdersShareholders pursuant to the compensation disclosure rules of the Securities and Exchange Commission, including the Compensation Discussion and Analysis, the 20192021 Summary Compensation Table and the other related tables and disclosure.”
74
The say-on-pay vote is advisory, and therefore not binding on the Company, the Compensation Committee or the Board. The Board and the Compensation Committee value the opinions of stockholdersshareholders and to the extent there is any
significant vote against the named executive officer compensation as disclosed in this proxy statement, the Company will consider stockholders'shareholders' concerns and the Compensation Committee will evaluate whether any actions are necessary to address those concerns.
The proposal will be approved if it receives the affirmative vote of a majority of shares represented in person or by proxy at the meeting.
75
SHAREHOLDER PROPOSALS
Any stockholdershareholder proposal intended for inclusion in the proxy materials for the Annual Meeting to be held in 20212023 must be received no later than December 31, 2020.2022. A stockholdershareholder may also nominate directors before the next Annual Meeting by submitting the nomination as described under “Board of Directors – Consideration of Director Nominees.” No formal proposals were received during 20192021 from stockholders.shareholders that were not subsequently withdrawn.
2021 ANNUAL REPORT
The Company’s Annual Report to StockholdersShareholders is being mailed to stockholdersshareholders along with this Proxy Statement. The Annual Report and the Annual Report on Form 10-K for the fiscal year ended December 31, 2019,2021, as filed with the Securities and Exchange Commission, are on the Company’s website at www.AmericanCampus.com and available without charge to stockholdersshareholders upon writing to the Company’s corporate secretary. Neither the Annual Report to StockholdersShareholders nor the Annual Report on Form 10-K for the fiscal year ended December 31, 2019,2021, is to be treated as part of the proxy solicitation materials or as having been incorporated herein by reference.
By Order of the Board of Directors,
DANIEL B. PERRY
Executive Vice President, Chief Financial Officer,
Treasurer and Secretary
Austin, Texas
[ ], 2022
[ ], 2022
76
APPENDIX A
SUPPLEMENTAL INFORMATION REGARDING PARTICIPANTS
The following tables (“Directors and Nominees” and “Executive Officers and Employees”) list the name and business address of the directors of the Company, nominees for director, and the name, present principal occupation and business address of the Company’s executive officers and employees who, under SEC rules, are considered to be participants in the Company’s solicitation of proxies from its shareholders in connection with the Annual Meeting (collectively, the “Participants”).
Directors and Nominees
The principal occupations of the Company’s current directors, all of whom are nominees for director at the Annual Meeting, are included in the biographies under the section titled “Governance of the Company.” The name of each of the Company’s directors and nominees for director is listed below, and the business address for all the of the Company’s directors and nominees for director is c/o American Campus Communities, Inc., 12700 Hill Country Blvd., Suite T-200, Austin, Texas 78738.
Name
William C. Bayless, Jr.
Herman E. Bulls
G. Steven Dawson
Cydney C. Donnell
Mary C. Egan
Alison M. Hill
Craig A. Leupold
Oliver Luck
C. Patrick Oles, Jr.
John T. Rippel
EXECUTIVE OFFICERS AND EMPLOYEES
The executive officers and other employees who are considered Participants as well as their positions with the Company, which constitute their respective principal occupations, are listed below. The business address for each person is c/o American Campus Communities, Inc., 12700 Hill Country Blvd., Suite T-200, Austin, Texas 78738.
| Name | Title | |||||||
| William C. Bayless, Jr. | Chief Executive Officer | ||||
| Jennifer Beese | President and Chief Operating Officer | ||||
| Jorge de Cárdenas | Executive Vice President and Chief Technology Officer | ||||
| Lonnie M. Ledbetter | Executive Vice President, Chief Purpose and Inclusion Officer | ||||
| Daniel B. Perry | Executive Vice President, Chief Financial Officer, Secretary and Treasurer | ||||
| William W. Talbot | Executive Vice President and Chief Investment Officer | ||||
| Kim K. Voss | Executive Vice President, Chief Accounting Officer and Assistant Secretary | ||||
| James E. Wilhelm III | Executive Vice President, Public-Private Transactions | ||||
| Brian Winger | Executive Vice President and General Counsel | ||||
Information Regarding Ownership of Company Securities by Participants
The number of the Company’s shares of common stock beneficially held as of March 1, 2022 by its directors and executive officers who are Participants appears in the “Security Ownership” section of this proxy statement. Except as described in this Appendix A or otherwise in this
77
proxy statement, none of the persons listed above in “Directors and Nominees” and “Executive Officers and Employees” owns any debt or equity security issued by us of record that he or she does not also own beneficially.
Transactions in the Company’s Securities by Participants—Last Two Years
The following table sets forth information regarding purchases and sales of the company’s securities by each Participant between March 1, 2020 and March 1, 2022. All transactions were in the public market or pursuant to the company’s equity compensation plans, and no part of the purchase price or market value of those shares is represented by funds borrowed or otherwise obtained for the purpose of acquiring or holding such securities.
| Name | Transaction Date | Number of Shares | Transaction Description | ||||||||
| William C. Bayless, Jr. | 4/29/20 | 4,260 | Charitable donation | ||||||||
| William C. Bayless, Jr. | 8/4/20 | 2,290 | Charitable donations | ||||||||
| William C. Bayless, Jr. | 9/22/20 | 120,000 | Open market sale | ||||||||
| William C. Bayless, Jr. | 11/6/20 | 1,800 | Charitable donation | ||||||||
| William C. Bayless, Jr. | 1/28/21 | 81,927.71 | Grant of restricted stock | ||||||||
| William C. Bayless, Jr. | 2/28/21 | 28,090.90 | Tax withholding | ||||||||
| William C. Bayless, Jr. | 3/15/21 | 2,010 | Charitable donations | ||||||||
| William C. Bayless, Jr. | 5/10/21 | 5,620 | Charitable donations | ||||||||
| William C. Bayless, Jr. | 11/8/21 | 1,667 | Charitable donation | ||||||||
| William C. Bayless, Jr. | 12/8/21 | 945 | Charitable donation | ||||||||
| William C. Bayless, Jr. | 1/24/22 | 88,874,81 | Grant of restricted stock | ||||||||
| William C. Bayless, Jr. | 2/28/22 | 29,776.70 | Tax withholding | ||||||||
| Jennifer Beese | 1/28/21 | 33,873.08 | Grant of restricted stock | ||||||||
| Jennifer Beese | 2/28/21 | 7,598.75 | Tax withholding | ||||||||
| Jennifer Beese | 6/2/21 | 10,000 | Open market sale | ||||||||
| Jennifer Beese | 12/20/21 | 1,264 | Charitable donation | ||||||||
| Jennifer Beese | 1/24/22 | 36,440.60 | Grant of restricted stock | ||||||||
| Jennifer Beese | 2/28/22 | 9,398.77 | Tax withholding | ||||||||
| Herman E. Bulls | 1/27/21 | 3,018 | Grant of restricted stock units and settlement entirely in stock | ||||||||
| Herman E. Bulls | 4/28/21 | 2,724 | Grant of restricted stock units and settlement entirely in stock | ||||||||
| G. Steven Dawson | 6/1/20 | 3,593 | Grant of restricted stock units and settlement entirely in stock | ||||||||
| G. Steven Dawson | 4/28/21 | 2,724 | Grant of restricted stock units and settlement entirely in stock | ||||||||
| Jorge de Cárdenas | 1/28/21 | 10,240.96 | Grant of restricted stock | ||||||||
| Jorge de Cárdenas | 2/28/21 | 1,301.52 | Tax withholding | ||||||||
| Jorge de Cárdenas | 8/3/21 | 8,555 | Open market sale | ||||||||
| Jorge de Cárdenas | 1/24/22 | 10,158.67 | Grant of restricted stock | ||||||||
| Jorge de Cárdenas | 2/28/22 | 2,210.96 | Tax withholding | ||||||||
| Cydney C. Donnell | 6/1/20 | 3,593 | Grant of restricted stock units and settlement entirely in stock | ||||||||
| Cydney C. Donnell | 4/28/21 | 3,780 | Grant of restricted stock units and settlement entirely in stock | ||||||||
| Mary C. Egan | 6/1/20 | 3,593 | Grant of restricted stock units and settlement entirely in stock | ||||||||
| Mary C. Egan | 4/28/21 | 2,724 | Grant of restricted stock units and settlement entirely in stock | ||||||||
| Alison M. Hill | 1/27/21 | 3,018 | Grant of restricted stock units and settlement entirely in stock | ||||||||
| Alison M. Hill | 4/28/21 | 2,724 | Grant of restricted stock units and settlement entirely in stock | ||||||||
78
| Lonnie M. Ledbetter | 1/28/21 | 3,855.42 | Grant of restricted stock | ||||||||
| Lonnie M. Ledbetter | 2/28/21 | 563.81 | Tax withholding | ||||||||
| Lonnie M. Ledbetter | 1/24/22 | 7,739.94 | Grant of restricted stock | ||||||||
| Lonnie M. Ledbetter | 2/28/22 | 1,122.94 | Tax withholding | ||||||||
| Craig A. Leupold | 1/27/21 | 3,018 | Grant of restricted stock units and settlement entirely in stock | ||||||||
| Craig A. Leupold | 4/28/21 | 2,724 | Grant of restricted stock units and settlement entirely in stock | ||||||||
| Oliver Luck | 6/1/20 | 3,593 | Grant of restricted stock units and settlement entirely in stock | ||||||||
| Oliver Luck | 4/28/21 | 2,724 | Grant of restricted stock units and settlement entirely in stock | ||||||||
| Daniel B. Perry | 1/28/21 | 28,010.43 | Grant of restricted stock | ||||||||
| Daniel B. Perry | 2/28/21 | 7,211.86 | Tax withholding | ||||||||
| Daniel B. Perry | 1/24/22 | 31,581.85 | Grant of restricted stock | ||||||||
| Daniel B. Perry | 2/28/22 | 8,464.40 | Tax withholding | ||||||||
| C. Patrick Oles, Jr. | 6/1/20 | 1,100 | Grant of 3,593 restricted stock units and partial settlement in stock | ||||||||
| C. Patrick Oles, Jr. | 4/28/21 | 1,612 | Grant of 2,724 restricted stock units and partial settlement in stock | ||||||||
| John T. Rippel | 3/9/20 | 10,000 | Open market purchase | ||||||||
| John T. Rippel | 5/22/20 | 30.69 | Dividend reinvestment | ||||||||
| John T. Rippel | 6/1/20 | 3,593 | Grant of restricted stock units and settlement entirely in stock | ||||||||
| John T. Rippel | 8/21/20 | 32.46 | Dividend reinvestment | ||||||||
| John T. Rippel | 9/1/20 | 33.98 | Dividend reinvestment | ||||||||
| John T. Rippel | 11/27/20 | 41.49 | Dividend reinvestment | ||||||||
| John T. Rippel | 1/27/21 | 200 | Open market purchase | ||||||||
| John T. Rippel | 4/28/21 | 2,724 | Grant of restricted stock units and settlement entirely in stock | ||||||||
| John T. Rippel | 1/21/22 | 10,000 | Open market purchase | ||||||||
| William W. Talbot | 11/09/2020 | 121 | Charitable donation | ||||||||
| William W. Talbot | 01/28/2021 | 35,175.90 | Grant of restricted stock | ||||||||
| William W. Talbot | 02/28/2021 | 9,241.35 | Tax withholding | ||||||||
| William W. Talbot | 03/24/2021 | 233 | Charitable donation | ||||||||
| William W. Talbot | 05/11/2021 | 22 | Charitable donation | ||||||||
| William W. Talbot | 07/29/2021 | 24 | Charitable donation | ||||||||
| William W. Talbot | 01/21/2022 | 98 | Charitable donation | ||||||||
| William W. Talbot | 01/24/2022 | 34,011.22 | Grant of restricted stock | ||||||||
| William W. Talbot | 02/28/2022 | 1,016 | Transfer to a charitable foundation in the reporting person's name who disclaims beneficial ownership of the shares, except to the extent of any indirect pecuniary interest therein. | ||||||||
| William W. Talbot | 02/28/2022 | 10,666.25 | Tax withholding | ||||||||
| Kim K. Voss | 06/09/2020 | 235 | Charitable donation | ||||||||
| Kim K. Voss | 12/31/2020 | 121 | Charitable donation | ||||||||
| Kim K. Voss | 1/28/21 | 10,843.37 | Grant of restricted stock | ||||||||
| Kim K. Voss | 2/28/21 | 3,147.49 | Tax withholding | ||||||||
| Kim K. Voss | 5/24/21 | 152 | Charitable donation | ||||||||
| Kim K. Voss | 5/25/21 | 203 | Charitable donation | ||||||||
| Kim K. Voss | 11/9/21 | 28 | Charitable donation | ||||||||
| Kim K. Voss | 11/26/21 | 28 | Charitable donation | ||||||||
79
| Kim K. Voss | 12/15/21 | 66 | Charitable donation | ||||||||
| Kim K. Voss | 1/24/22 | 10,158.67 | Grant of restricted stock | ||||||||
| Kim K. Voss | 2/28/22 | 3,477.41 | Tax withholding | ||||||||
| James E. Wilhelm III | 1/28/21 | 8,192.77 | Grant of restricted stock | ||||||||
| James E. Wilhelm III | 2/28/21 | 1,823.16 | Tax withholding | ||||||||
| James E. Wilhelm III | 7/20/21 | 4,742 | Open market sale under 10b-5 trading plan | ||||||||
| James E. Wilhelm III | 10/26/21 | 12,123 | Open market sale under 10b-5 trading plan | ||||||||
| James E. Wilhelm III | 10/27/21 | 191 | Open market sale under 10b-5 trading plan | ||||||||
| James E. Wilhelm III | 11/3/21 | 5,396 | Open market sale under 10b-5 trading plan | ||||||||
| James E. Wilhelm III | 1/24/22 | 7,739 | Grant of restricted stock | ||||||||
| James E. Wilhelm III | 2/28/22 | 1,809.03 | Tax withholding | ||||||||
| Brian Winger | 1/28/21 | 9,638.55 | Grant of restricted stock | ||||||||
| Brian Winger | 2/28/21 | 841.28 | Tax withholding | ||||||||
| Brian Winger | 1/24/22 | 8,707.43 | Grant of restricted stock | ||||||||
| Brian Winger | 2/28/22 | 1,134.12 | Tax withholding | ||||||||
80
 | Shareowner Services P.O. Box 64945 St. Paul, MN 55164-0945 | PRELIMINARY, SUBJECT TO COMPLETION | ||||||
WHITE PROXY CARD (repeat on opposite side)
Please detach here
The Board of Directors Recommends a Vote FOR Items 1, 2 and 3.
| 1. | Election of Directors for a one-year term expiring at the | |||||||||||||||||||||
| 1a. | William C. Bayless, Jr. | For | ||||||||||||||||||||
| 1b. | Herman E. Bulls | ☐ | For | ☐ | Withhold | |||||||||||||||||
| 1c. | G. Steven Dawson | For | ||||||||||||||||||||
| Cydney C. Donnell | For | |||||||||||||||||||||
| Mary C. Egan | For | |||||||||||||||||||||
| For | ||||||||||||||||||||||
| Craig A. Leupold | ☐ | For | ☐ | Withhold | ||||||||||||||||||
| 1h. | Oliver Luck | For | ||||||||||||||||||||
| C. Patrick Oles, Jr. | For | |||||||||||||||||||||
| John T. Rippel | For | |||||||||||||||||||||
| 2. | Ratification of Ernst & Young as our independent auditors for | For | Against | Abstain | |||||||||||||||||||||||||
3. | To provide a non-binding advisory vote approving the Company’s executive compensation program | For | Against | Abstain | |||||||||||||||||||||||||
THIS WHITE PROXY CARD WHEN PROPERLY EXECUTED WILL BE VOTED AS DIRECTED OR, IF NO DIRECTION IS GIVEN, WILL BE VOTED AS THE BOARD RECOMMENDS.
Address Change or Comments? Mark box, sign, and indicate changes below: | Date | |||||||||||||
Signature(s) in Box Please sign exactly as your name(s) appears on Proxy. If held in joint tenancy, all persons should sign. Trustees, administrators, etc., should include title and authority. Corporations should provide full name of corporation and title of authorized officer signing the Proxy. | ||||||||||||||
AMERICAN CAMPUS COMMUNITIES, INC.
ANNUAL MEETING OF STOCKHOLDERSSHAREHOLDERS
8:00 a.m. EasternCentral Time
Important notice regarding the Internet availability of
proxy materials for the Annual Meeting of StockholdersShareholders
The Proxy Statement and the 20192021 Annual Report to StockholdersShareholders are available in the Investor Relations section
of our website at www.AmericanCampus.com under “SEC Filings”Filings.”
| American Campus Communities, Inc. 12700 Hill Country Boulevard, Suite T-200 Austin, TX 78738 | proxy | ||||||
This WHITE proxy CARD is solicited by the Board of Directors for use at the Annual Meeting on April 29, 2020.[ ], 2022.
If no choice is specified, the proxy will be voted as the Board recommends on Items 1, 2 and 3.
The undersigned hereby appoints William C. Bayless, Jr. and Daniel B. Perry, or any of them, proxies of the undersigned, with full powers of substitution, to represent the undersigned and to vote all shares of Common Stock of American Campus Communities, Inc. held of record by the undersigned as of the close of business on March 9, 2020,[ ], 2022, on behalf of the undersigned at the Annual Meeting of StockholdersShareholders to be held on April 29, 2020,[ ], 2022, at 8:00 a.m., Eastern Central Time, in the Lantana Room of Disney’s Coronado Springs Resort located at 1000 W Buena Vista Drive, Orlando, Florida12700 Hill Country Boulevard, Suite T-200, Austin, Texas 78738 or at any adjournment or postponement thereof.
THE VOTES ENTITLED TO BE CAST BY THE UNDERSIGNED WILL BE CAST AS DIRECTED. IF THIS PROXY IS PROPERLY EXECUTED BUT IF NO DIRECTION IS GIVEN, THE VOTES ENTITLED TO BE CAST BY THE UNDERSIGNED WILL BE CAST AS THE BOARD RECOMMENDS ON ITEMS 1, 2 andAND 3.
Address Change/Comments
(Mark the corresponding box on the reverse side)
See reverse for voting instructions.